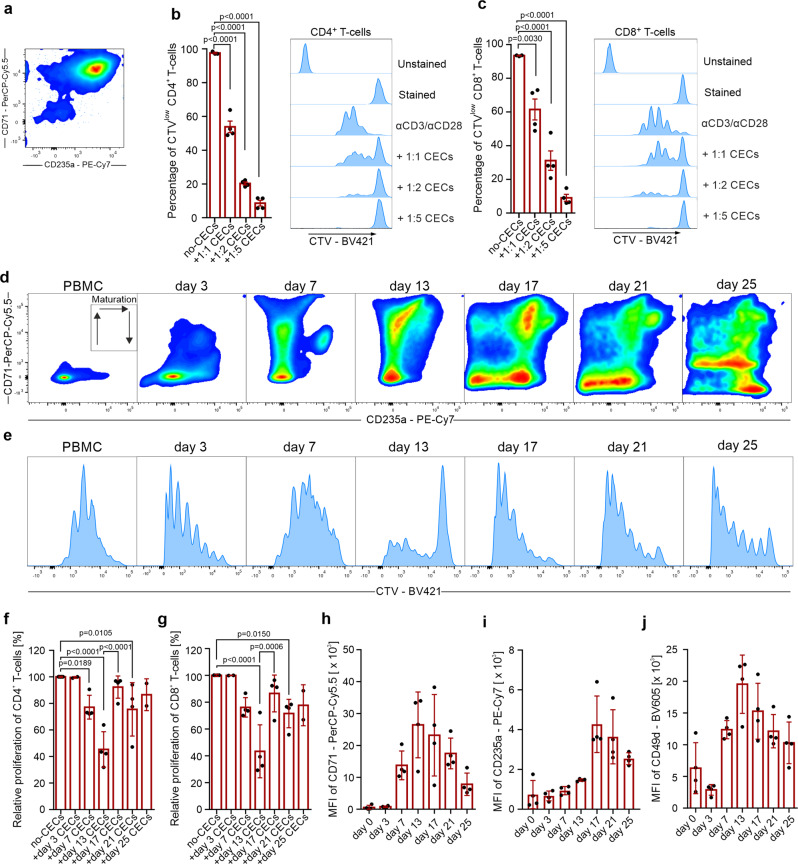
Fig. 10. Suppression of T cells is a general feature of erythroid cells that diminishes with CECs maturation.
a Representative plot of isolated CECs differentiated from PBMCs. b, c Proliferation of CTV-labeled CD4+ (b) and CD8+ (c) T cells triggered by αCD3/αCD28 co-cultured with CECs differentiated from PBMCs (n = 4). P values were calculated with one-way ANOVA with Dunnett’s post hoc test. d Representative density plots of CEC differentiation from PBMCs based on CD71 and CD235a expression. e Proliferation of CTV-labeled CD4+ triggered by αCD3/αCD28 co-cultured with CEC-PBMCs at different developmental stages at 1:4 ratio. f, g Relative proliferation of CD4+ (f) and CD8+ (g) T cells co-cultured with CEC-PBMCs at different time points at a 1:4 ratio. P values were calculated with one-way ANOVA with Bonferroni’s post hoc test. h–j Levels of CD71 (h), CD235a (i), and CD49d (j) during erythroid differentiation from PBMCs. Data show means ± SD. Each point in b, c, f–j represents data from individual patients. n values are the numbers of individual patients used to obtain the data or the number of biological replicates in in vitro experiments. The source data underlying b, c, f–j are provided as a Supplementary Data 2 file.

