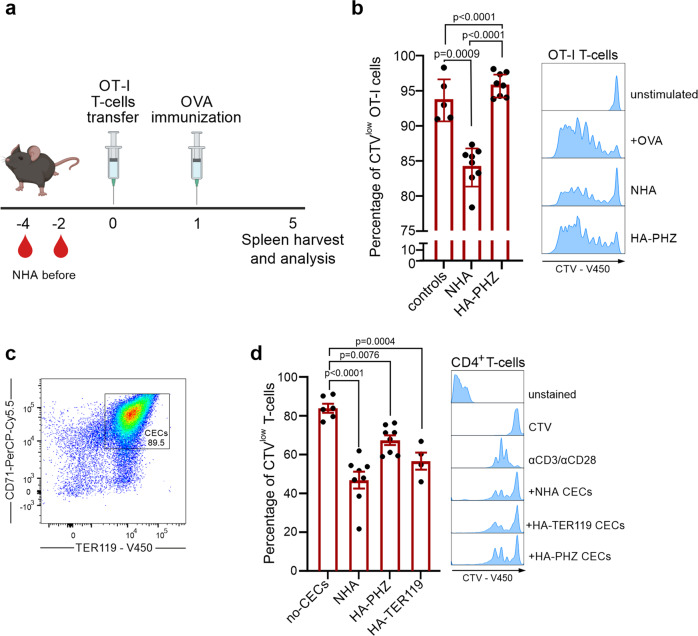
Fig. 2. Anemic mice have impaired T cell immune response.
a Schematic presentation of the experimental setting. T cells isolated from OT-I mice were labeled with CellTraceViolet (CTV) and adoptively transferred to anemic and healthy control mice and stimulated with OVA. Scheme created using BioRender.com. b Percentage of proliferating (CTVlow) OT-I T cells in the spleen of NHA mice (n = 8), HA-PHZ mice (n = 8), and healthy controls (n = 5). Histograms show the fluorescence of CTV (CellTraceViolet)-V450 of OT-I T cells. P values were calculated with one-way ANOVA with Tukey’s post hoc test. c Representative plot of CD71 and TER119 levels in isolated CECs. Additional plots are presented in Supplementary Fig. 4. d Proliferation triggered by αCD3/αCD28 in CTV-labeled CD4+ T cells co-cultured with CECs isolated from the spleens of NHA (n = 8), HA-PHZ (n = 8), or HA-TER119 (n = 4) mice. T cell:CECs ratio was 1:2. Representative proliferation histograms of αCD3/αCD28-stimulated CD4+ T cells co-cultured with CECs. Histograms show the fluorescence of CTV (CellTraceViolet)-V450. P values were calculated with one-way ANOVA with Dunnet’s post hoc test. Data show means ± SD. Each point in b, d represents data from individual mice. n values are the numbers of mice. The source data underlying b, d are provided as a Supplementary Data 2 file.

