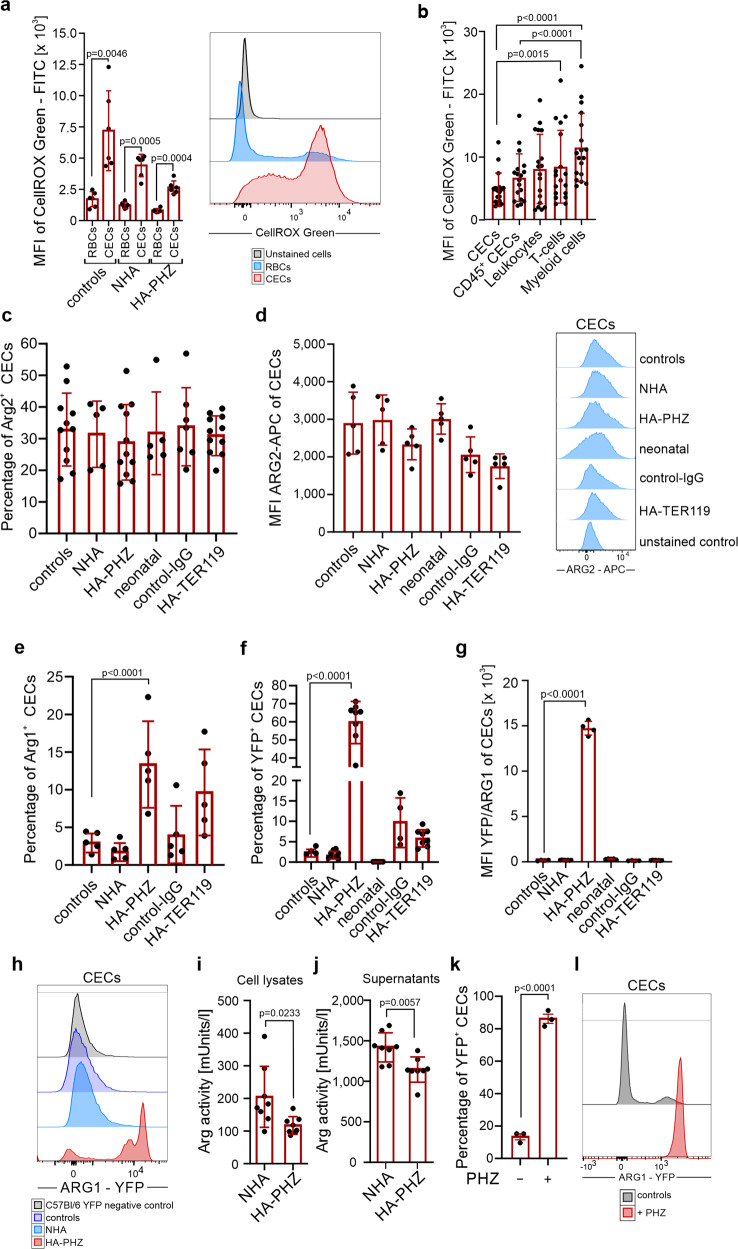
Fig. 3. CECs from anemic mice express ARG2 and have high levels of ROS.
a Mean fluorescence intensity (MFI) of CellROX Green-FITC in CECs (CD71+TER119+) and RBCs (CD71−TER119+) of control (n = 6), NHA (n = 6), and HA-PHZ (n = 6) mice. Histograms show representative fluorescence of CellROX Green-FITC in CECs and RBCs from the spleens of the NHA mouse. P values were calculated with unpaired t-test. b MFI of CellROX Green-FITC in CECs (CD71+TER119+), CD45+ CECs (CD45+CD71+TER119+), leukocytes (CD45+TER119−), T cells (CD45+CD3e+), and myeloid cells (CD45+CD11b+) (n = 18). P values were calculated with Friedman’s test with Dunn’s post hoc test. c Percentages of ARG2+ CECs in control mice (n = 11), anemic mice (NHA, n = 5; HA-PHZ, n = 11; HA-TER119, n = 11), neonatal mice (n = 5), and isotype control-IgG-treated mice (control-IgG, n = 7) based on intracellular staining. d MFI of ARG2-APC in CECs from control mice, anemic mice (NHA, HA-PHZ, HA-TER119), neonatal mice, and isotype control-IgG-treated mice (each group n = 5). Histograms show the representative fluorescence of ARG2-APC in CECs in different groups and in anti-ARG2-unstained controls. e Percentages of ARG1+ CECs based on intracellular staining (n = 5). P values were calculated with one-way ANOVA with Dunnet’s post hoc test and with an unpaired t-test for HA-TER119. f Percentages of YFP+ CECs in reporter B6.129S4-Arg1tm1Lky/J mice (controls n = 4, NHA n = 8, HA-PHZ n = 8, neonatal n = 5, control-IgG n = 4, HA-TER119 n = 8). P values were calculated with one-way ANOVA with Dunnet’s post hoc test and with an unpaired t-test for HA-TER119. g MFI of YFP-FITC in CECs of reporter B6.129S4-Arg1tm1Lky/J mice in control mice (n = 4), anemic (NHA n = 8, HA-PHZ n = 4, HA-TER119 n = 8), neonatal mice (n = 5), and isotype control-IgG-treated mice (n = 4). P values were calculated with one-way ANOVA with Dunnet’s post hoc test. h Representative fluorescence of ARG1-YFP in CECs in reporter B6.129S4-Arg1tm1Lky/J control mice and anemic mice (NHA, HA-PHZ). Background fluorescence of YFP in CECs from wild-type C57Bl/6 mice presented as a negative YFP control. i, j Total arginase activity in CECs lysates (i n = 8) or in the supernatants from CECs cultures (j n = 8). P values were calculated with one-way ANOVA with unpaired t-test. k, l Percentages of ARG1+ CECs (k) isolated from the spleens of B6.129S4-Arg1tm1Lky/J incubated with diluent or PHZ (100 µM for 24 h) (n = 3) and representative fluorescence of ARG1-YFP (l). P values were calculated with unpaired t-test. Data show means ± SD. Each point in a–g, i–k represents data from individual mice. n values are the numbers of mice used to obtain the data. The source data underlying a–g, i–k are provided as a Supplementary Data 2 file.

