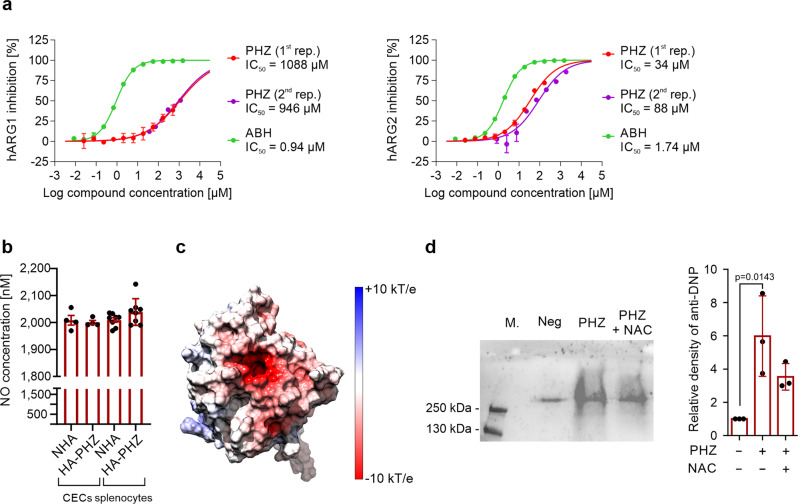
Fig. 4. Phenylhydrazine targets arginase, inhibits its activity, and induces oxidative damage.
a Inhibition curves for recombinant human ARG1 and ARG2, and IC50 values for PHZ (n = 2) and 2(S)-amino-6-boronohexanoic acid (ABH). b NO production from CECs and whole splenocytes population isolated from NHA (n = 4) and HA-PHZ (n = 4) mice. P values were calculated with an unpaired t-test. c The electrostatic surface potential of the human ARG1. The potential was calculated with APBS and projected onto the molecular surface of the protein. The figure was prepared with UCSF Chimera. d Carbonylation of ARG1 in the presence of PHZ (n = 3). Representative blot (left) and densitometric analysis done with ImageJ software (right). The negative lane represents ARG1 precipitates treated with 2 N HCl alone. P values were calculated with ordinary one-way ANOVA with Dunnett’s multiple comparisons test. Data show means ± SD. Each point in b represents data from individual mice. n values are the numbers of mice used to obtain the data or the number of biological replicates of in vitro experiments. The source data underlying a, b, d are provided as a Supplementary Data 2 file.

