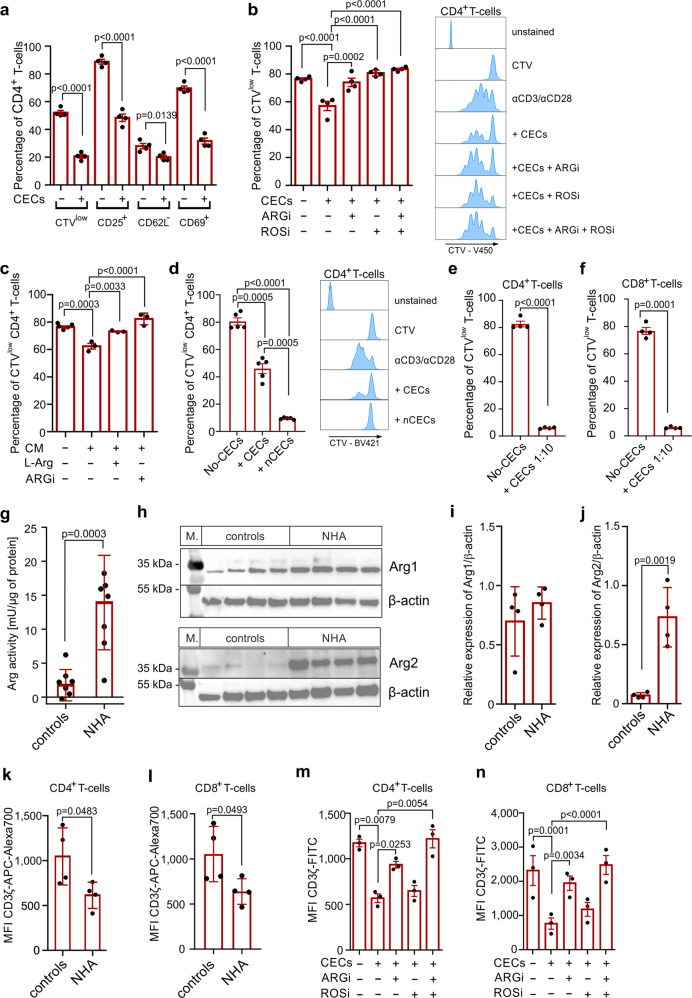
Fig. 5. CECs degrade l-Arg and produce ROS leading to the suppression of T cells.
a Proliferation and surface markers in αCD3/αCD28-stimulated CD4+ T cells co-cultured with CECs isolated from NHA mice (n = 4) at a ratio 1:2 (T cells:CECs). P value was calculated with an unpaired t-test. b Effects of ARGi (OAT-1746, 500 nM) and ROSi (N-acetylcysteine, 100 µM) on the proliferation of αCD3/αCD28-stimulated CD4+ T cells co-cultured with CECs isolated from the spleens of NHA mice (n = 4) at a ratio 1:2 (T cells:CECs). Representative proliferation histograms of αCD3/αCD28-stimulated CD4+ T cells co-cultured with CECs in the presence of ARGi or ROSi. Histograms show the fluorescence of CTV (CellTraceViolet)-V450. P value was calculated with one-way ANOVA with Bonferroni’s post hoc test. c Effects of ʟ-arginine supplementation (1000 µM) or ARGi (OAT-1746, 500 nM) on the proliferation of αCD3/αCD28-stimulated CD4+ T cells cultured in full medium or in CECs-conditioned medium (CM) (n = 3). P value was calculated with one-way ANOVA with Bonferroni’s post hoc test. d Proliferation of αCD3/αCD28-stimulated CD4+ T cells co-cultured with total CECs population or with nucleated CECs (nCECs) isolated using density-gradient centrifugation from NHA mice (n = 5) at a ratio 1:2 (T cells:CECs). Histograms show the fluorescence of CTV (CellTraceViolet)-V450. P value was calculated with repeated measures ANOVA with Holm–Sidak’s post hoc test. e, f Proliferation of αCD3/αCD28-stimulated CD4+ T cells (e) or CD8+ T cells (f) co-cultured with CECs isolated from NHA mice (n = 4) at a ratio 1:10 (T cells:CECs). P value was calculated with paired t-test. g Arginase activity of the splenocytes lysate of control and anemic mice calculated per µg of total protein based on bicinchoninic acid (BCA) protein assay. P value was calculated with an unpaired t-test. h The level of ARG1 and ARG2 in the splenocytes lysate of control (n = 4) and anemic mice (n = 4). β-Actin showed as a loading control. i, j Relative density of ARG1 (i) and ARG2 (j) compared to β-actin. P value was calculated with an unpaired t-test. k, l The level of CD3ζ in CD4+ (k) and CD8+ (l) T cells in the spleen of control (n = 4) and anemic mice (n = 4) based on intracellular staining. P value was calculated with an unpaired t-test. m, n The levels of CD3ζ in CD4+ (m) and CD8+ (n) αCD3/αCD28-stimulated T cells in the presence of CECs isolated from NHA mice (n = 4) based on intracellular staining. P value was calculated with one-way ANOVA with Bonferroni’s post hoc test. Data show means ± SEM (a–f, m, n) or means ± SD (h, i–l). Each point in a–g, i–n represents data from individual mice. n values are the numbers of mice used to obtain the data or the number of biological replicates in in vitro experiments. The source data underlying a–n are provided as a Supplementary Data 2 file.

