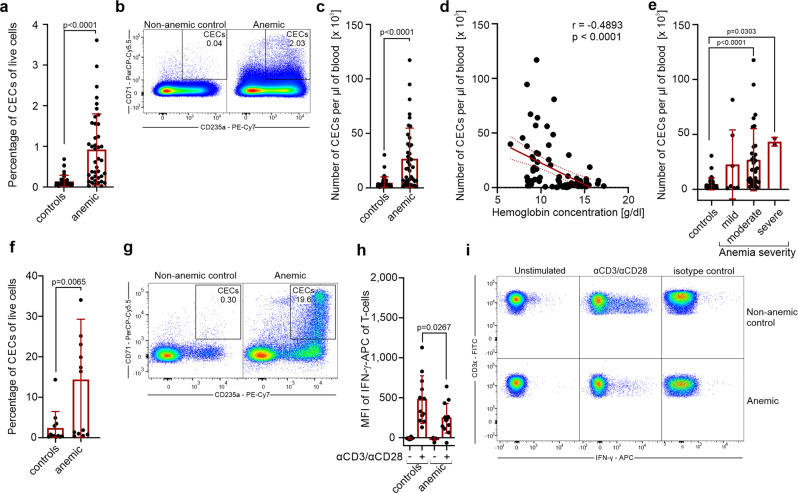
Fig. 7. CECs expand in the blood of anemic patients and suppress T cells response.
a Percentages of live CD71+CD235a+ CECs in the whole blood of non-anemic (controls, n = 42) and anemic patients (n = 41). P value was calculated with the Mann–Whitney test. b Representative dot plots of CECs in the blood of non-anemic and anemic patients. c CECs count per µl of blood in controls (n = 42) and anemic patients (n = 41). P value was calculated with the Mann–Whitney test. d Correlation of the number of CECs per µl of blood and hemoglobin concentration (n = 82). The correlation was calculated with Spearman r. e CECs count per µl of blood in non-anemic controls (n = 42) and patients with mild (n = 7), moderate (n = 32), and severe (n = 2) anemia. P values were calculated with Kruskal–Wallis test with Dunn’s post hoc test. f, g Percentages of CECs in the fraction of peripheral blood mononuclear cells (PBMC) in controls (n = 12) and anemic patients (n = 13) (f) and representative dot plots of CECs (g). P value was calculated with the Mann–Whitney test. h PBMCs of controls (n = 12) and anemic patients (n = 13) were stimulated with αCD3/αCD28 for 12 h in the presence of a protein transport inhibitor. IFN-γ levels were determined by intracellular staining. P values were calculated with an unpaired t-test. i Representative plots of IFN-γ levels in unstimulated or αCD3/αCD28-stimulated CD3ε+ T cells from PBMCs of anemic patients or non-anemic controls. Isotype control-stained cells are shown as a negative control. Data show means ± SD. Each point in a, c–f, h represents data from individual patients. n values are the numbers of patients used to obtain the data or the number of biological replicates in in vitro experiments. The source data underlying a, c–f, h are provided as a Supplementary Data 2 file.

