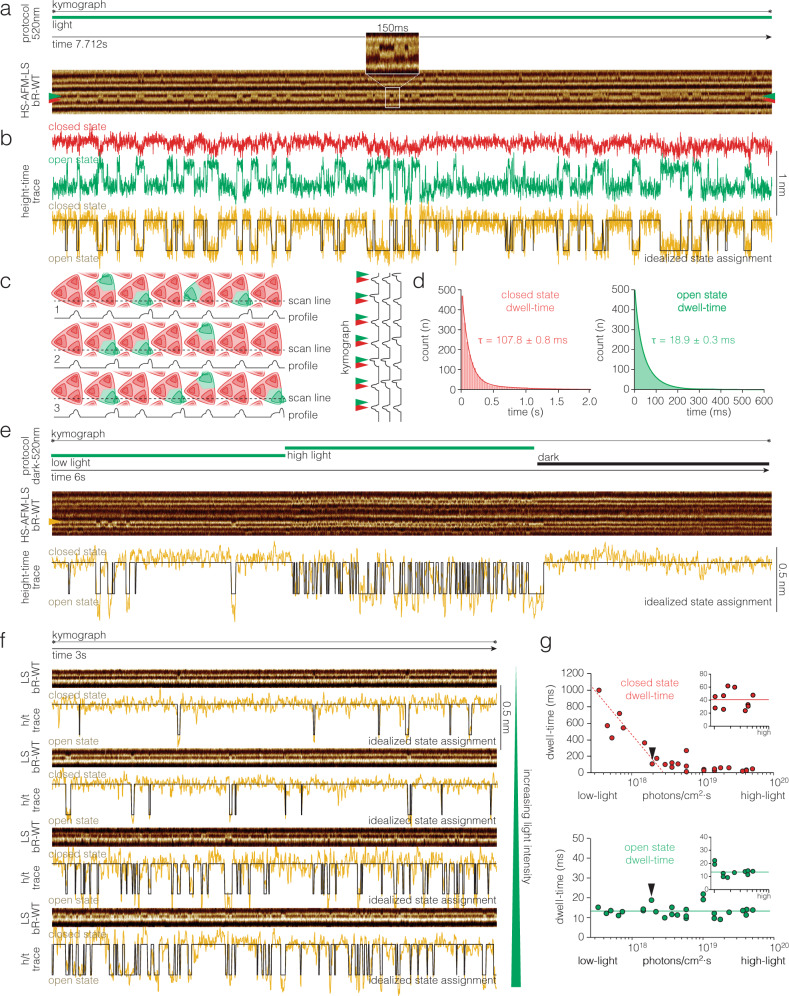
Fig. 2. bR-WT single molecule kinetics of reaction cycle conformational changes under continuous light with millisecond temporal resolution.
a Top: Light protocol: Continuous light of predefined intensity. Bottom: HS-AFM-LS raw data kymograph. Red and green arrowheads indicate the closed and open state positions of a single protomer, respectively. Inset: 150 ms of the kymograph illustrating the clarity of the raw data comprising well resolved ~10 ms-events. The protomer E-F loop shifts position in the kymograph. b Height-time traces along the red (closed) and green (open) state E-F loop positions in a. To enhance the signal-to-noise ratio, we subtract the two anticorrelated signals (red and green traces) to get the yellow trace which is used for idealized state assignment (black trace, see Methods). c Schematic of bR trimers and the HS-AFM-LS x-scan line. The x-scan line contours closed (red) and open (green) protomers, giving location depend signatures in the contour profiles (below). The profiles are stacked to give a kymograph (right). Red and green arrowheads indicate the closed and open state positions as in a. d Dwell-time histograms of (a) and many more kymographs with closed state τclosed = 107.8 ± 0.8 ms (red, n = 483) and open state τopen = 18.9 ± 0.3 ms (green, n = 471) at 1.9·1018 photons/cm2·s light intensity. e Response of bR-WT protomers to changing light conditions. Top: Light protocol: Low light – high light – dark. Middle: HS-AFM-LS raw data kymograph. Yellow arrowhead: protomer whose activity is shown below. Bottom: Height-time trace (yellow) and idealized state assignment (black). f HS-AFM-LS raw data kymographs (top) and height-time traces (yellow) and idealized state assignments (black) (bottom) at different light intensities (the green triangle on the right symbolizes increasing light intensity from top to bottom). g Dwell-times in the closed (red, top) and the open (green, bottom) states as a function of light intensity. Error bars in g are smaller than the data points, see d. Black arrowheads in g indicate the data points from d. Insets: At saturating light power <τ>closed = 40.5 ms and <τ>open = 13.2 ms. n is the total number of events analyzed. τ denotes dwell-time as the fit of the single exponential fit, .

