
Figure 2.
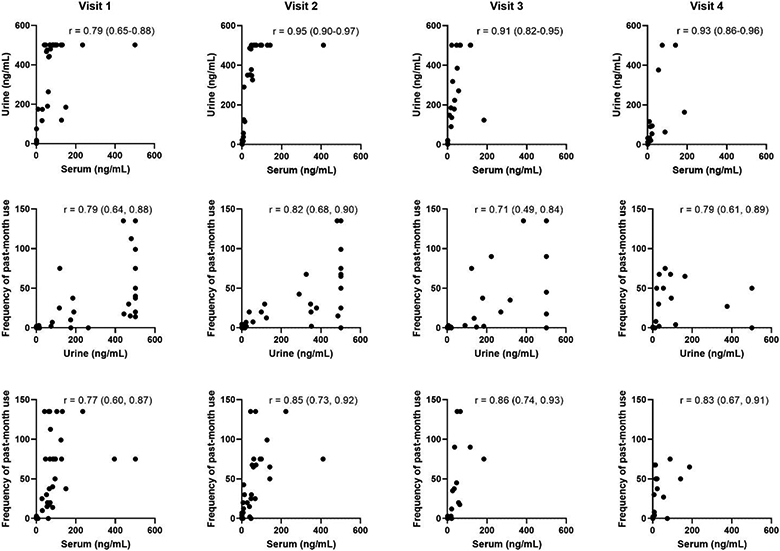
Correlations between self-reported frequency of past-month use, serum THC-COOH, and urine THC-COOH at each of the study visits. All values are in ng/mL. Spearman’s correlation coefficients are reported with 95% confidence intervals. Clustering of values at 500 ng/mL for urine represents the upper limit of detection of the assay.