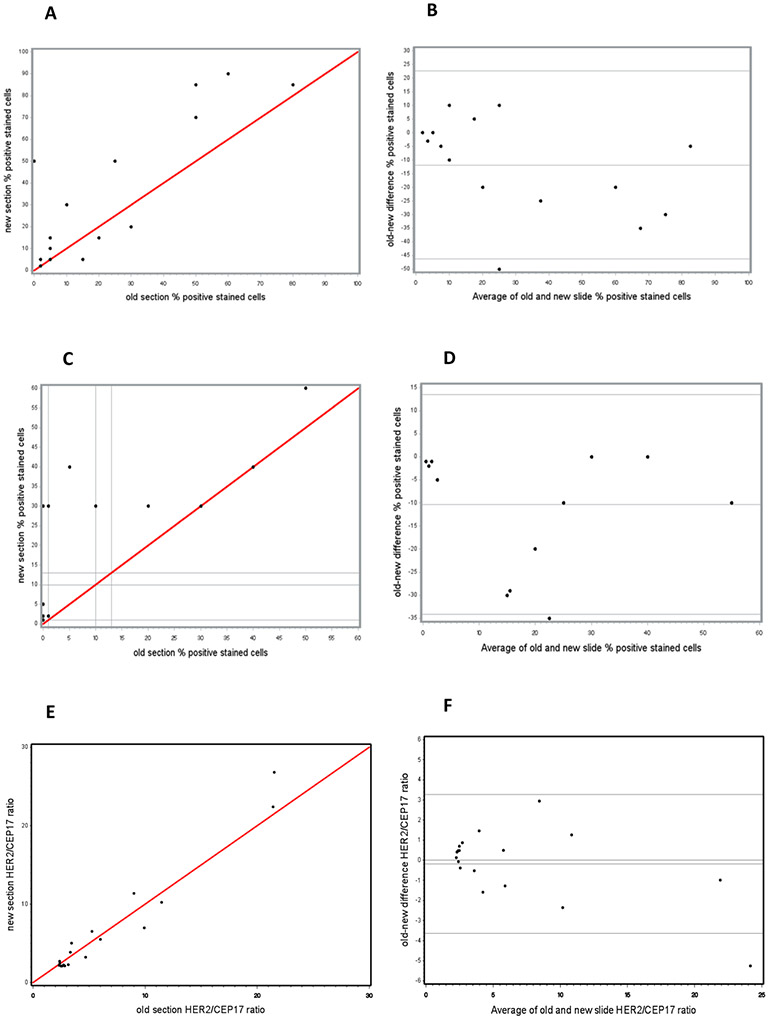
Fig. 3.
Graphical presentation of percentages of IHC positive cells for TOP2A (A & B) and Ki67 (C & D) and FISH HER2/CEP17 ratios (E & F) in new and old cut sections for each case of endometrial cancer. (A, C & E) Scatter Plots of identity: red lines mark agreement. (B, D & F) Bland-Altman Plots of difference. Solid grey lines mark the average difference and the limits of agreement specified as an average difference ± 1.96 x Standard Deviation. (A & C) Percentages of stained cells in new slides were mapped against percentages of stained cells in old slides from the same cases for TOP2A and Ki67, respectively. (B & D) Differences in percentages of cells stained positive between new and old sections were mapped against average values of percentages of positive cells from pairs of new and old sections for TOP2A (B) and Ki67 (D). In old slides, the difference from values in new slides ranged between 50% lower and 10% higher for TOP2A and between 0% and 35% lower for Ki67. Statistically significant loss of staining in stored slides by an estimated 12% for TOP2A and 10% for Ki67 was detected. (E) HER2/CEP17 ratios in new slides were mapped against HER2/CEP17 ratios in old slides from the same cases. (F) Differences in HER2/CEP17 ratios between new and old sections were mapped against average values of HER2/CEP17 ratios from pairs of new and old sections. In old slides, the variability from new slides ranged between 5.2 lower and 3.0 higher with an average estimated HER2/CEP17 ratio lover by 0.1 showing no difference from new sections.

