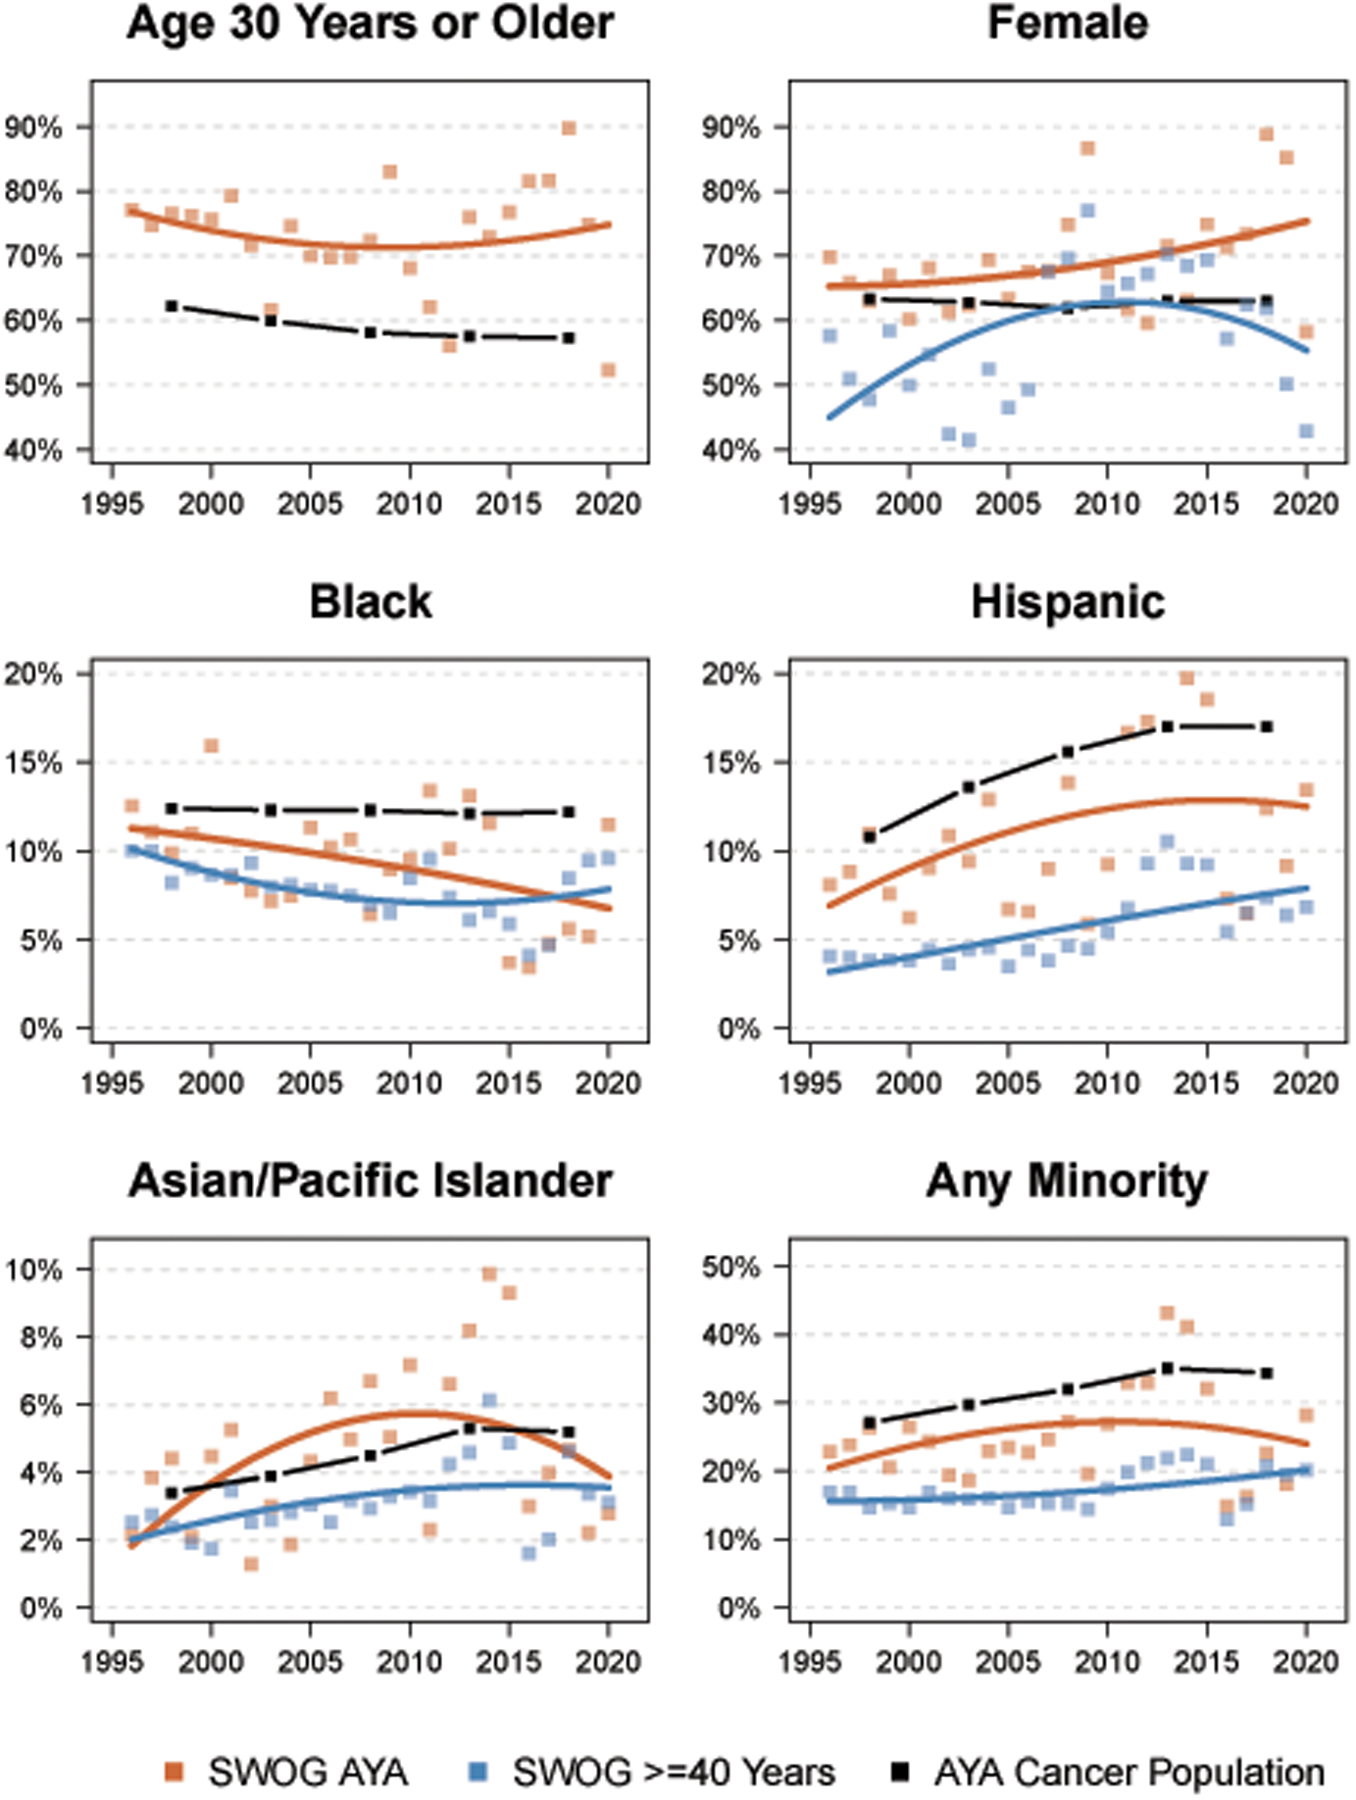
Figure 4:

Representation by age, sex, race, and ethnicity groups among AYA patients over time by year. The squares represent observed rates for SWOG AYA patients (orange) and SWOG patients >=40 years of age (blue). Loess regression lines were plotted to indicate temporal trends. Observed rates in 5-year intervals for the U.S. cancer population of AYA patients are represented by the black boxes, connected by lines.
