
Figure 2. Spatiotemporal and network properties of a single PaSNA episode.
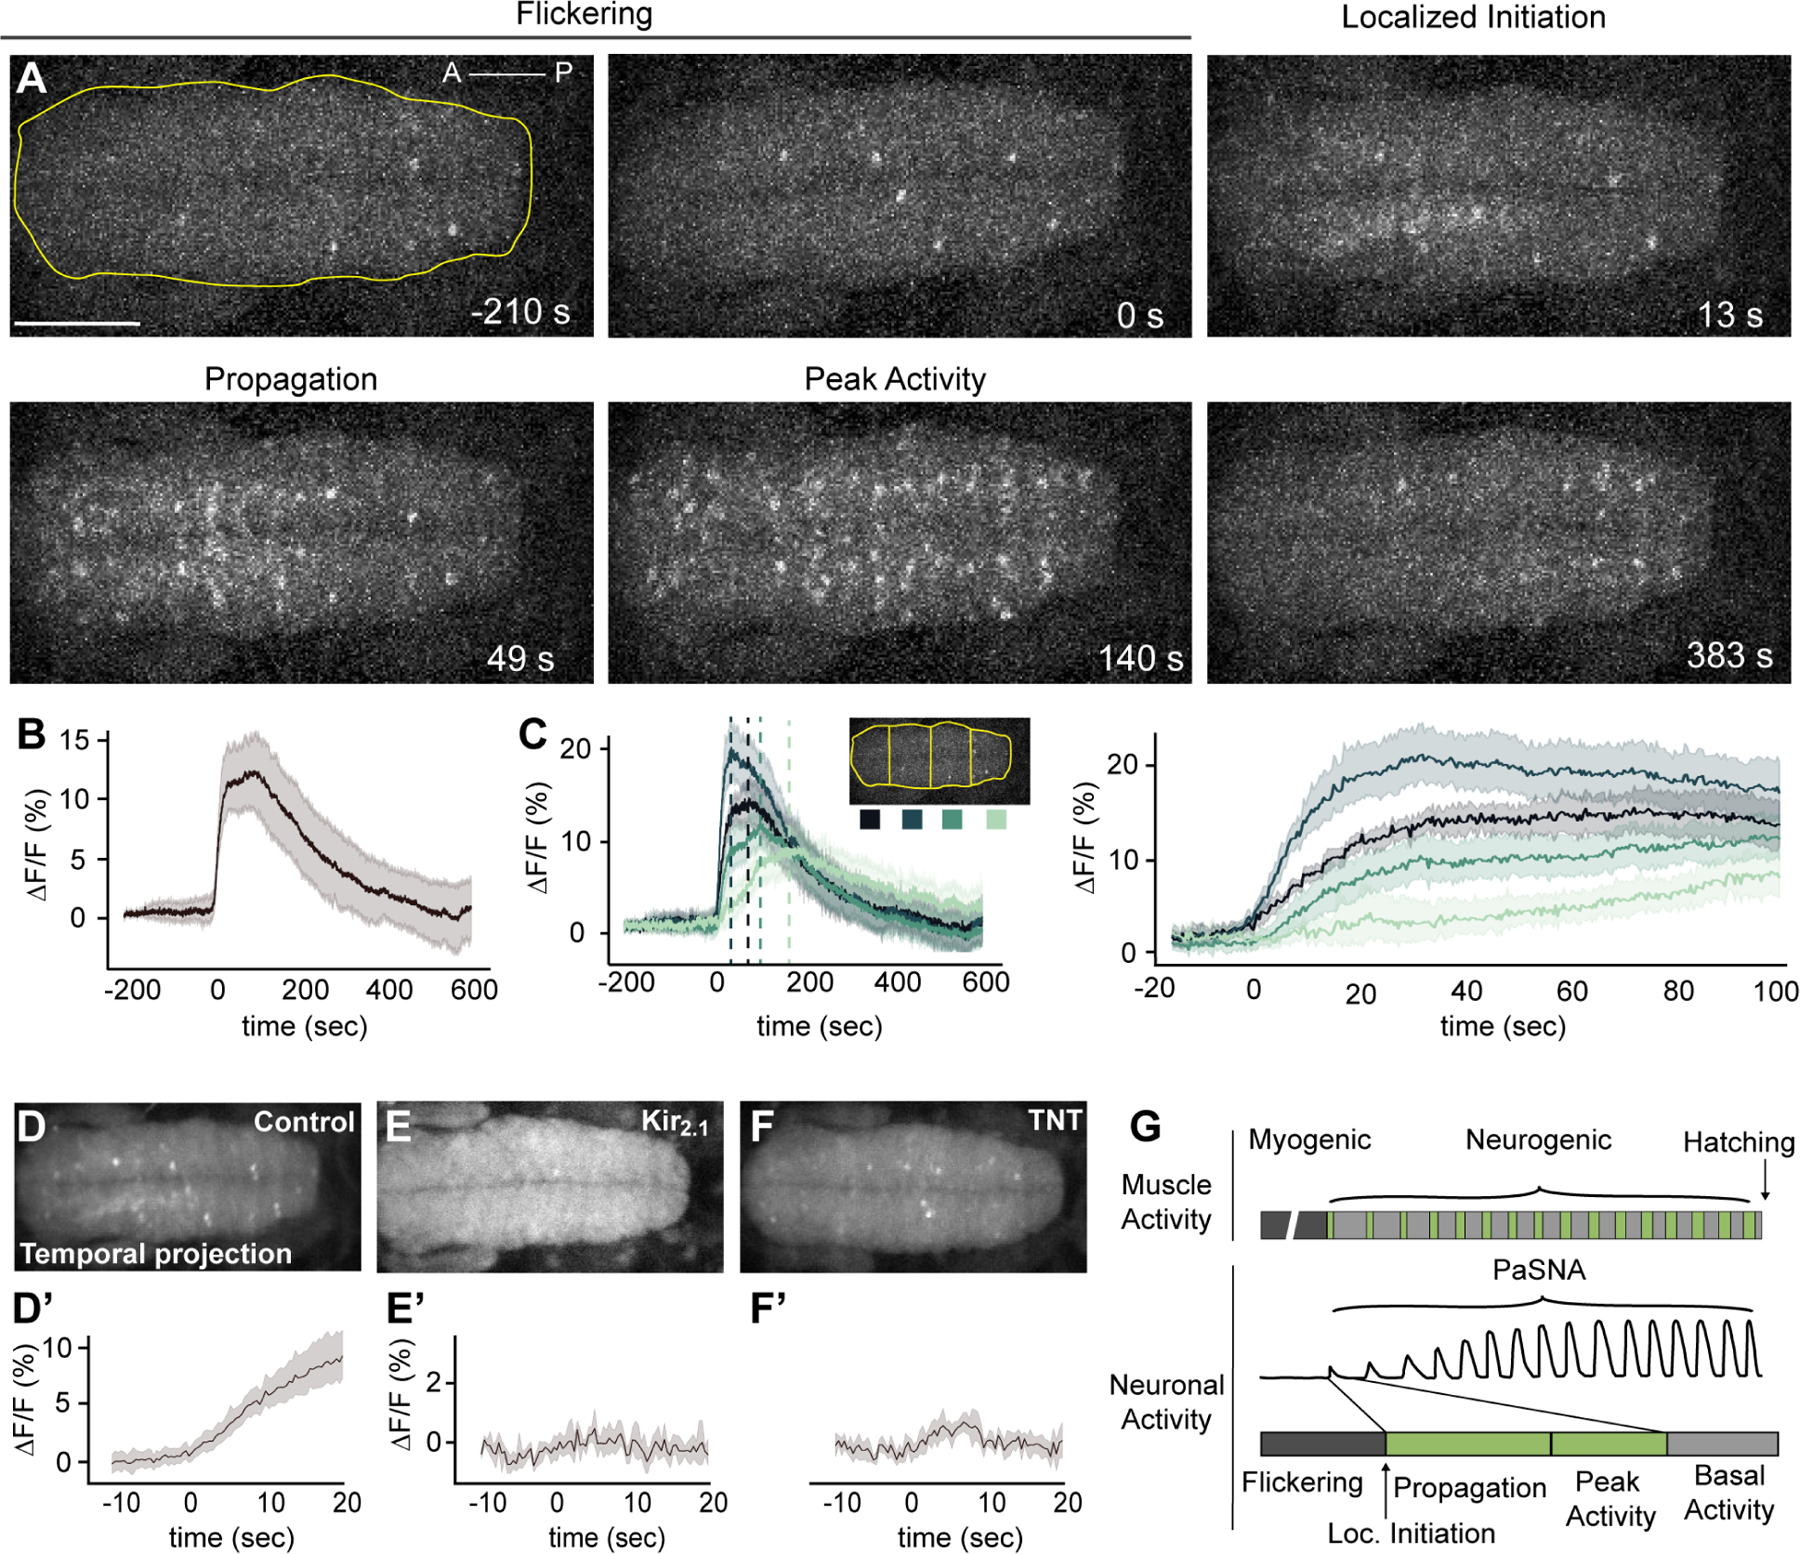
(A) Image frames during the first episode of PaSNA in an embryo. Phases labeled on top. Images are maximum intensity projections from an embryonic VNC expressing pan-neuronal GCaMP6s. Time stamps are relative to the positive inflection point caused by the activity burst. Yellow line delineates the VNC, with the ROI used for Panel B. Scale bar: 50 μm. (B) ΔF/F trace of the entire VNC during the first episode of PaSNA (n = 8). (C) ΔF/F of the color-coded four ROIs. Left displays −200 seconds to 600 seconds; right displays from −20 to 100 seconds relative to the initiation of PaSNA. (D-F’) Temporal projections (top) and ΔF/F VNC traces (bottom) for 30 seconds near the localized initiation time of the episode for control embryos (n = 8) (D), embryos expressing Kir2.1 pan-neuronally (E) (n = 5) and embryos expressing TNT pan-neuronally (F) (n = 6). (G) Schematic of Drosophila larval locomotor development showing activity at the muscle (top) and neuronal level (bottom). For all time series, dark lines represent the mean, while shading depicts the 95%CI. See also Video S2, S3, S4. For genotype information see Table S1.