
Figure 4. Temporal embryonic inhibition of mechanosensory input leads to abnormal larval behavior.
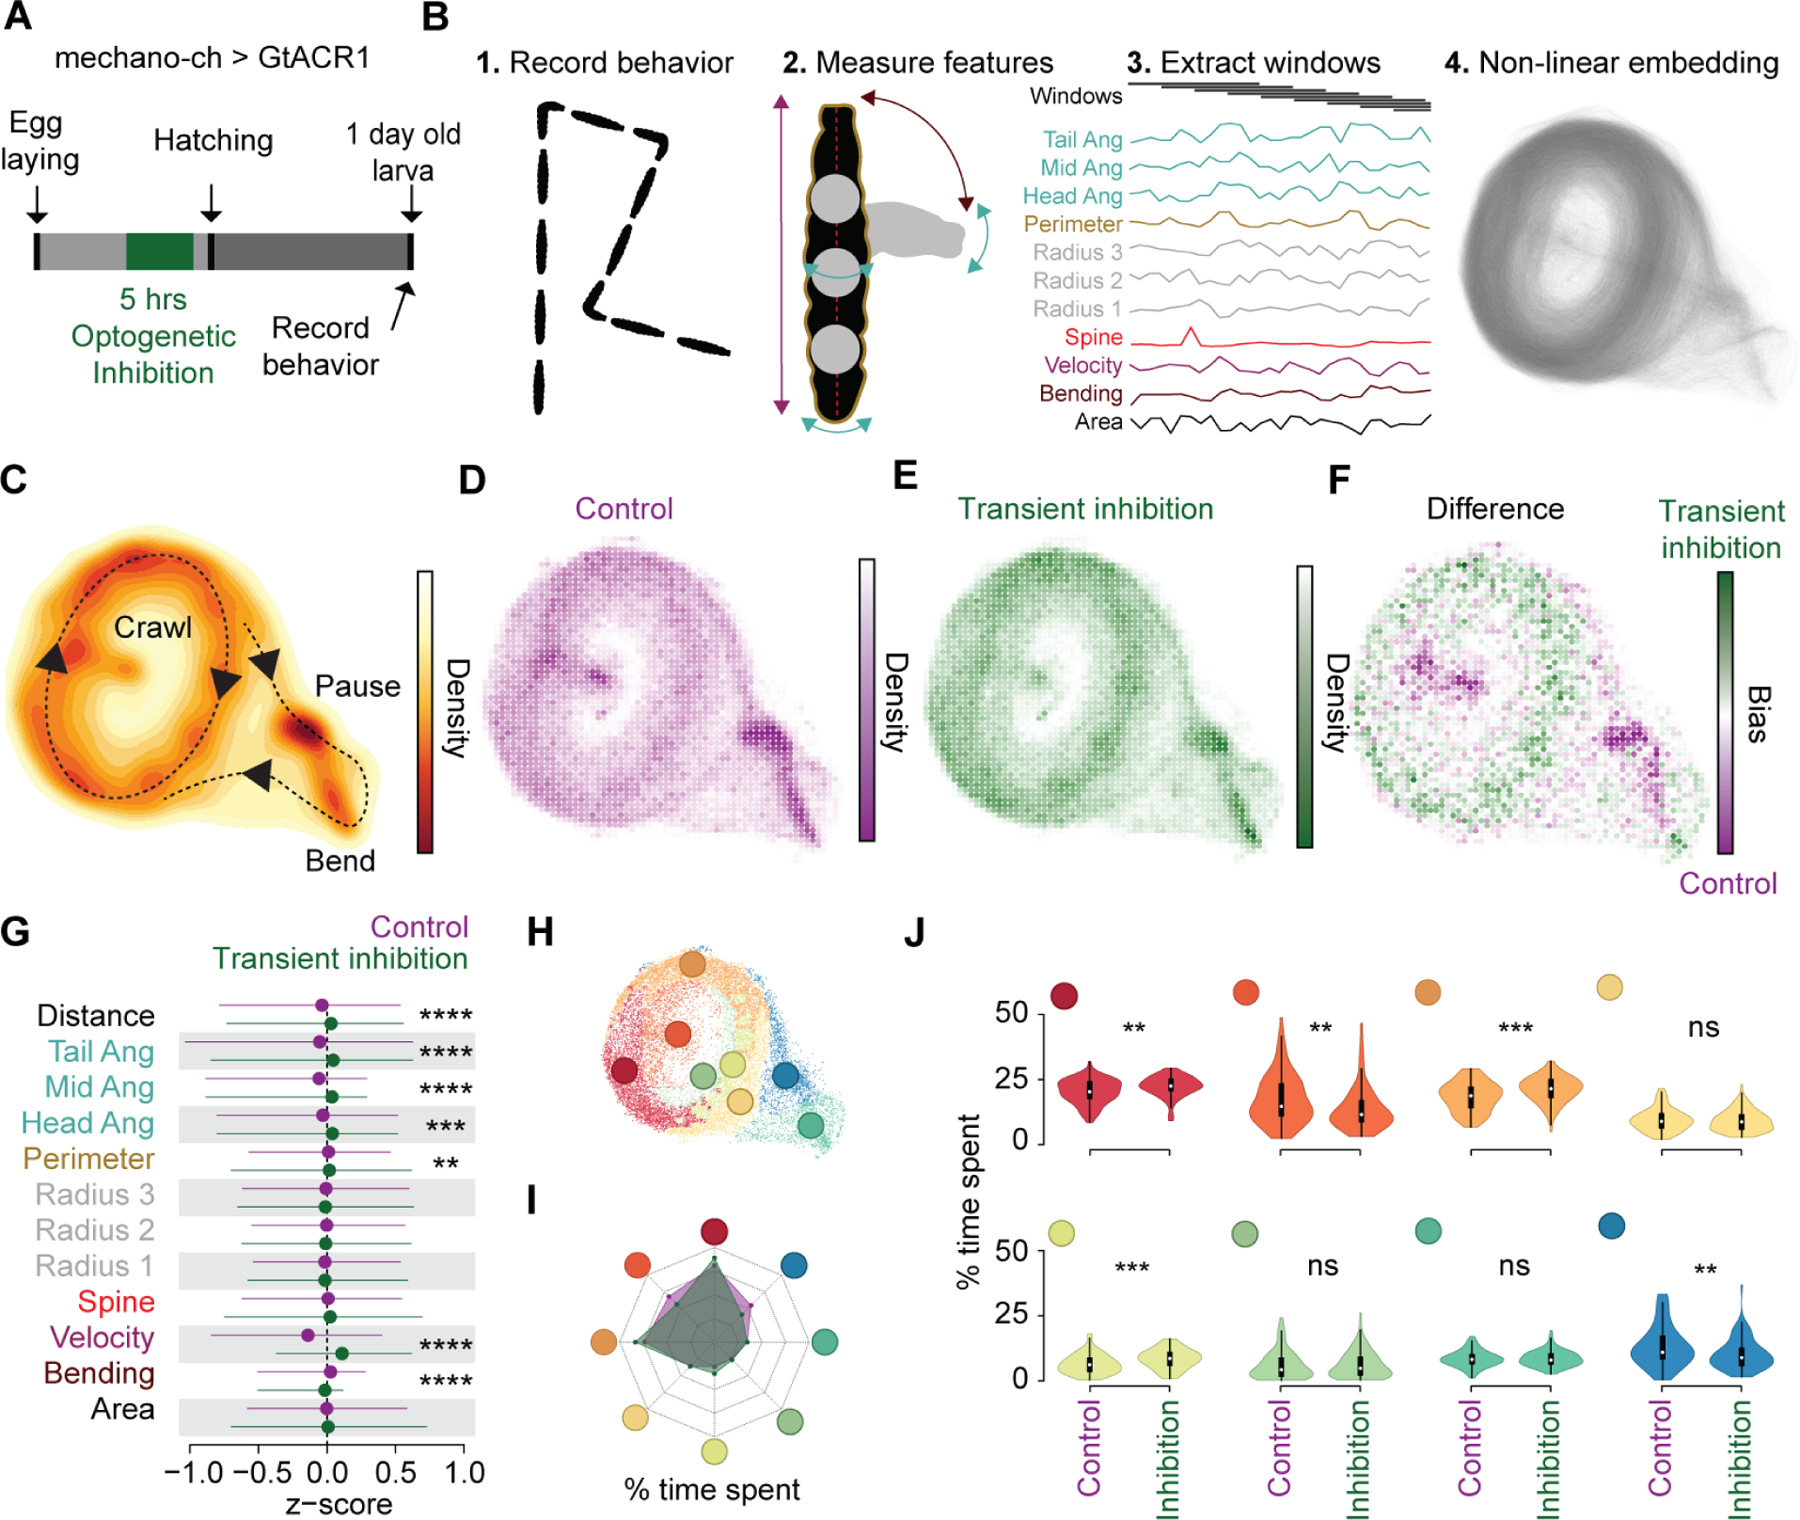
(A) Schematic of experimental design. (B) Workflow for Time Resolved BehavioraL Embedding (TREBLE) (Methods). (C) Probability density function of larval locomotor space plotted as a heatmap. Behaviors annotated qualitatively. Density scale to the right. (D-E) Bin-wise occurrence distributions for control (n= 84) (D) and transient inhibition (n = 97) (E) groups. (F) Difference map between control (purple) and transiently inhibited (green) animals. Bias scale to the right. (G) Comparison of primary behavioral features between control (purple) and transiently inhibited (green) larvae. (H) Behavioral space colored via Louvain clusters (Methods). (I) Radar chart comparing the percentage of time spent in each of the Louvain clusters for control (purple shade) and transient inhibition (green shade) groups. (J) Differences in occurrence in each behavioral cluster between control and transiently inhibited animals. **** p < 0.0001, *** p< 0.001, ** p < 0.01. For (G) we used trial-wise Kruskal-Wallis test with Bonferroni correction. For (J) we used trial-wise Kruskal-Wallis test. See also Figure S3. For genotype information see Table S1.