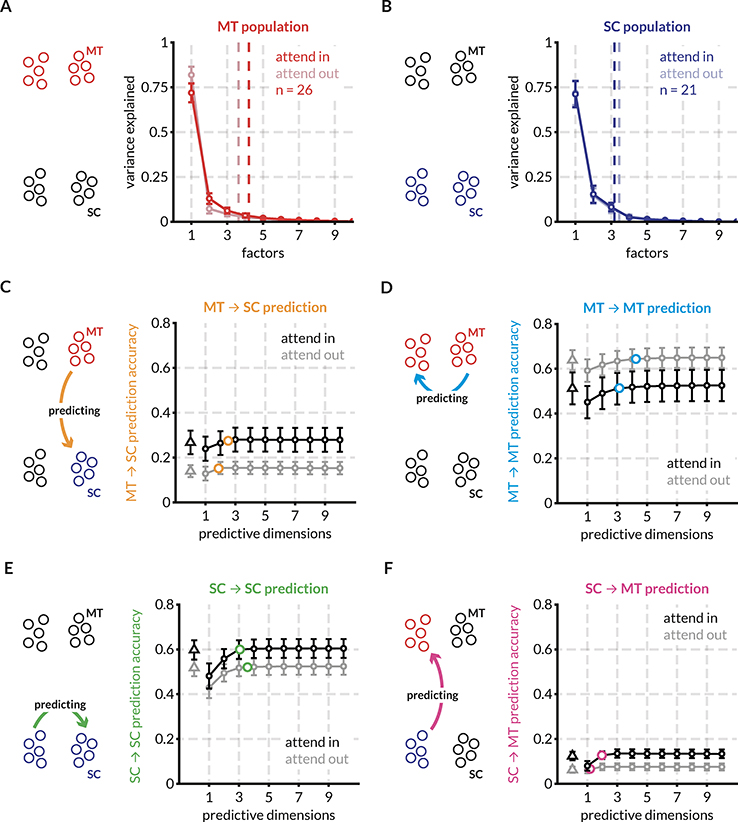
Figure 3: Randomly partitioned populations of MT and SC neurons predict activity within and across areas better with attention for the same example session.
To compare prediction performance for inter- and intra-areal interactions, we randomly split both the populations of MT and SC neurons into two halves each – the target and source halves – as indicated in the icons. Each source half was used to predict the activity of both target halves using both the full linear model (ridge regression) and the reduced-rank (RR) regression model. This split was done 20 times and the mean performance across the random splits is shown in c-f. Error bars indicate the SEM across these splits.
A: Factor analysis of MT neurons reveals that 95% of the variance in the MT response fluctuations can be accounted for by ~ 4 dimensions on average across all splits for this session. The number of population dimensions is greater for the attend in condition vs the attend out condition.
B: Same as (A) for SC neurons. For this session, SC population fluctuations are captured by ~ 3 dimensions in both attention conditions.
C: Average prediction performance for the full model (black and gray triangles) and the RR regression model (black and grey circles) across random splits of the MT and SC populations. The orange circle indicates the average optimum performance and average number of optimum prediction dimensions across the random splits. For each session, this point of optimum performance is plotted in different comparisons in the following figures. For this session, attention improves MT ➔ SC prediction performance. For all predictions, the RR regression model performs at least on par with the full linear model using ridge regression.
D: same as (C) for MT ➔ MT predictions. For this session, attention degrades prediction performance. The average optimum performance and average optimum prediction dimensions are indicated with blue circles.
E: same as (C) for SC ➔ SC predictions. For this session, attention improves prediction performance. The average optimum performance and average optimum prediction dimensions are indicated with green circles.
F: same as (C) for SC ➔ MT predictions. For this session, attention improves prediction performance. The average optimum performance and average optimum prediction dimensions are indicated with pink circles.

