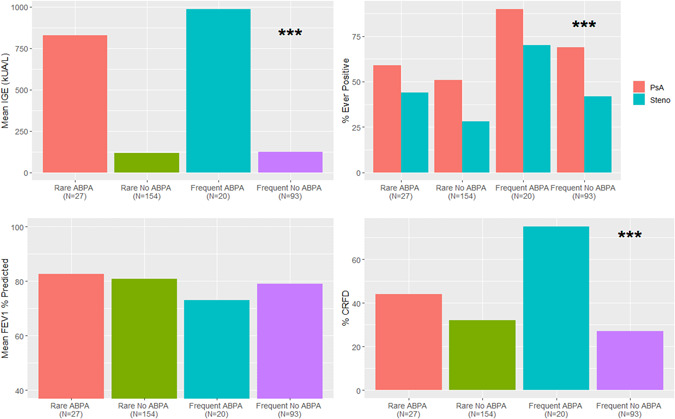
Figure 1.

Comparison during follow‐up study period for individuals classified by fungal and ABPA status of (A) mean IgE ng/ml, (B) co‐infections with Pseudomonas aeruginosa and Stenotrophomonas maltophilia, (C) mean ppFEV1 and (D) percent with CFRD. ***p < .001. ABPA, allergic bronchopulmonary aspergillosis; CFRD, CF related diabetes; IgE, immunoglobulin E [Color figure can be viewed at wileyonlinelibrary.com]
