
Figure 5.
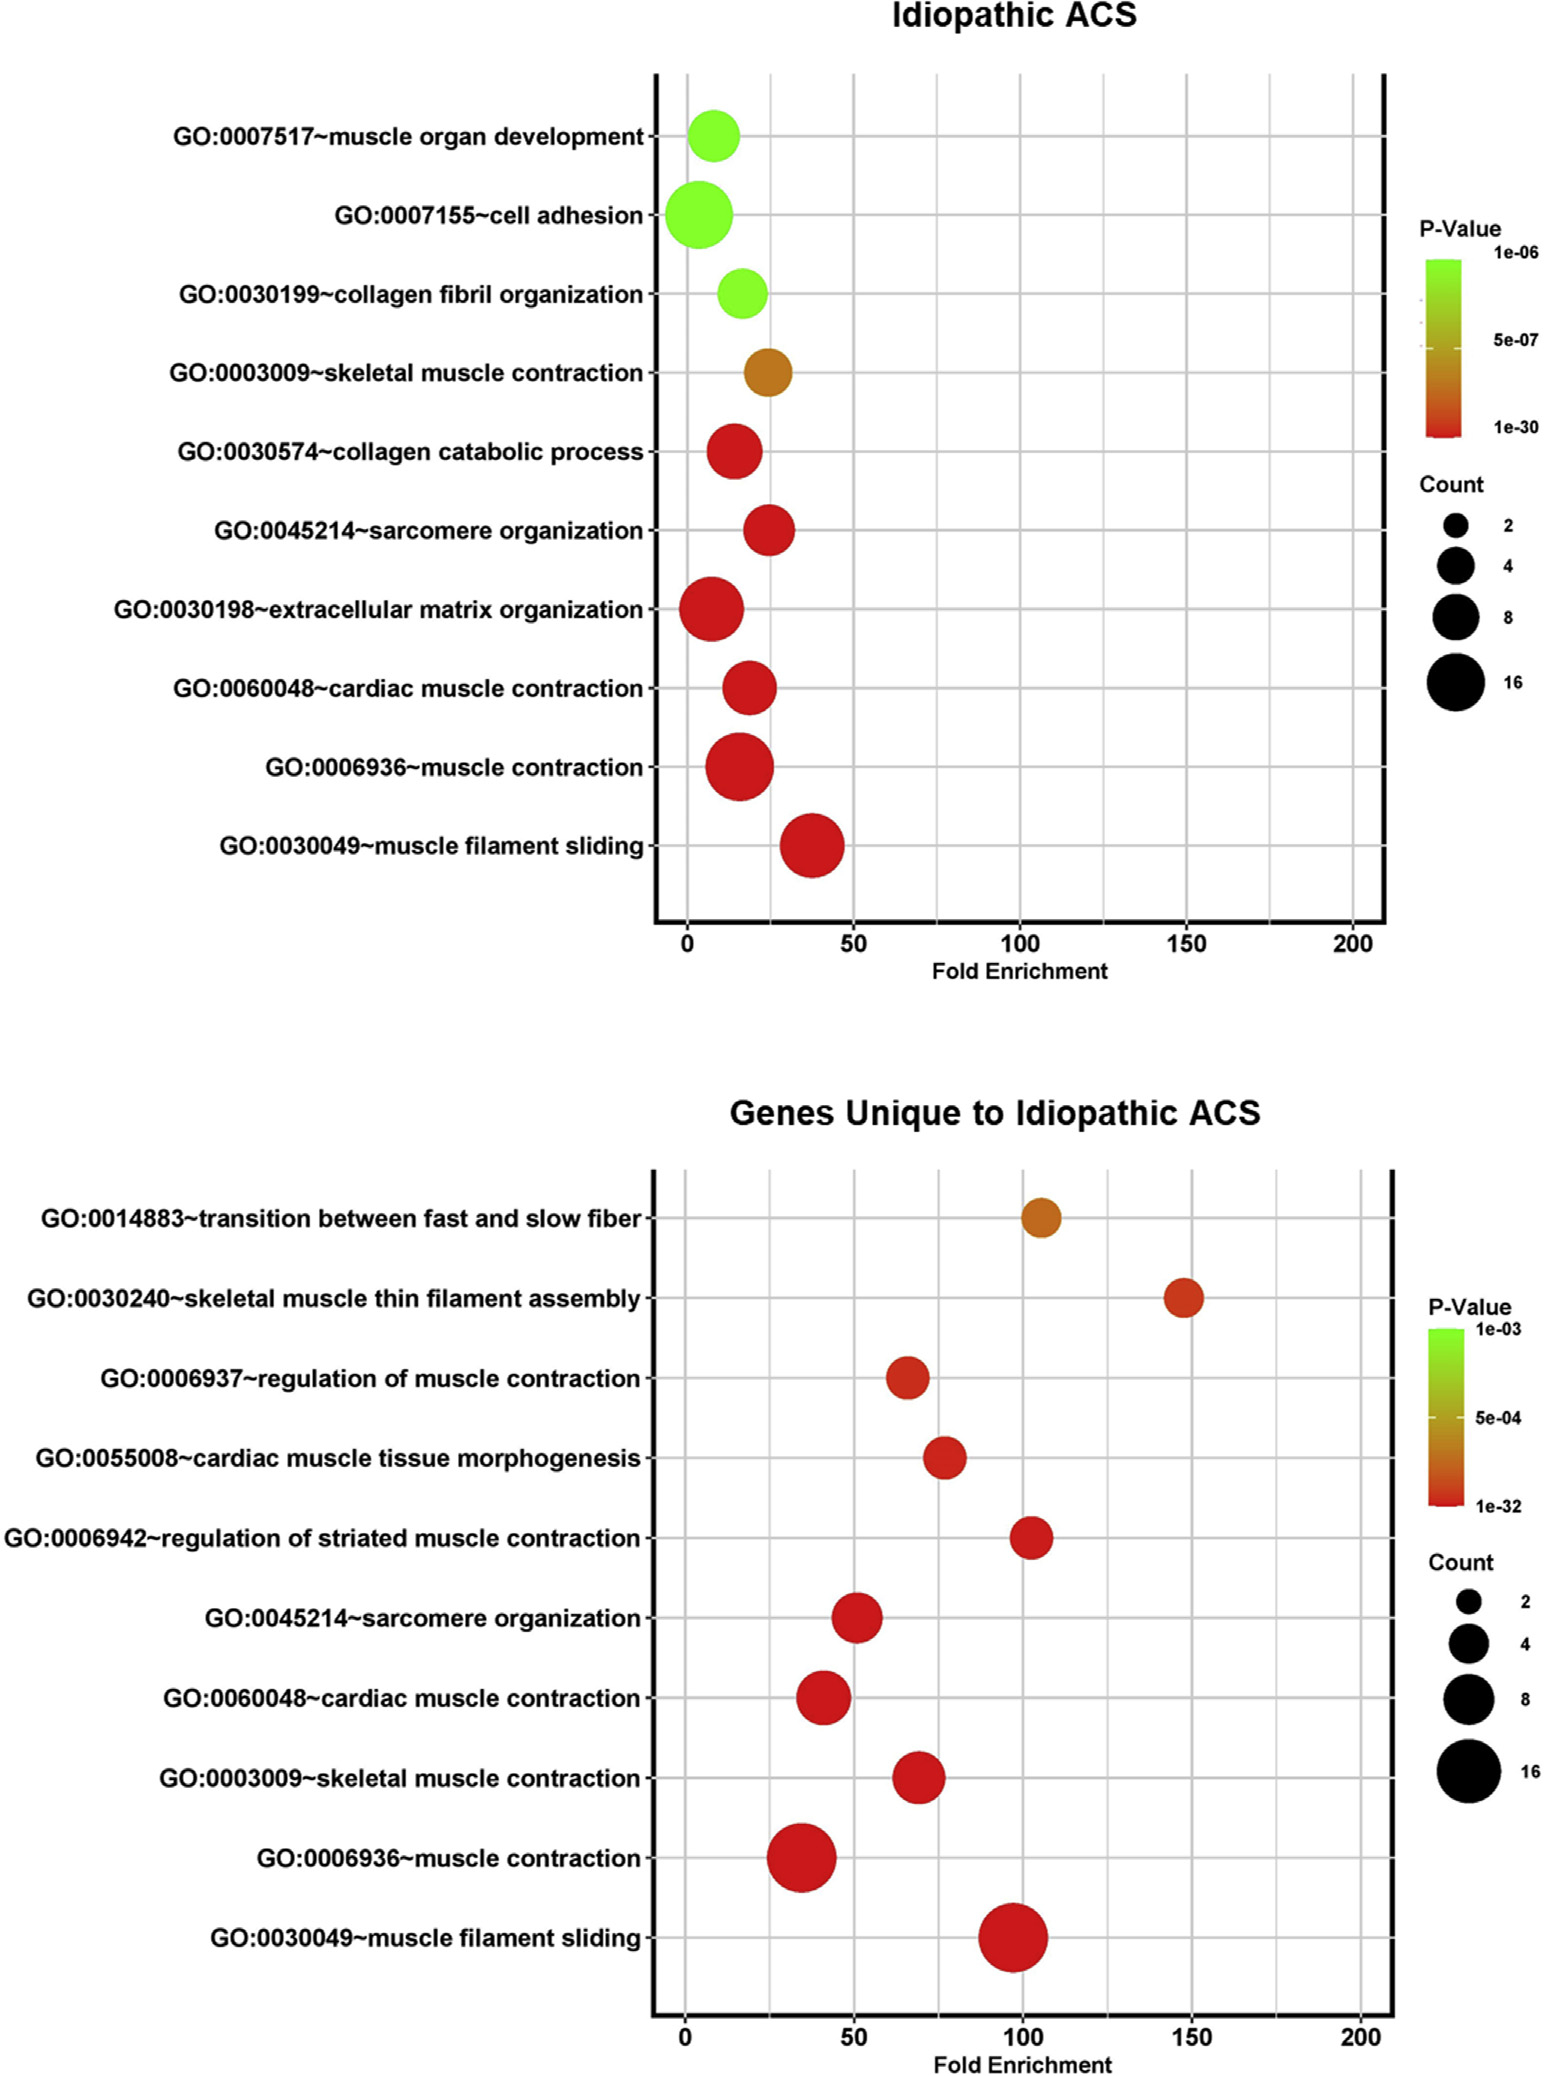
Bubble plots demonstrating fold enrichment for the most statistically significant biological pathways identified by Gene Ontology (GO) analysis for idiopathic adhesive capsulitis (ACS).
Official websites use .gov
A
.gov website belongs to an official
government organization in the United States.
Secure .gov websites use HTTPS
A lock (
) or https:// means you've safely
connected to the .gov website. Share sensitive
information only on official, secure websites.
Bubble plots demonstrating fold enrichment for the most statistically significant biological pathways identified by Gene Ontology (GO) analysis for idiopathic adhesive capsulitis (ACS).