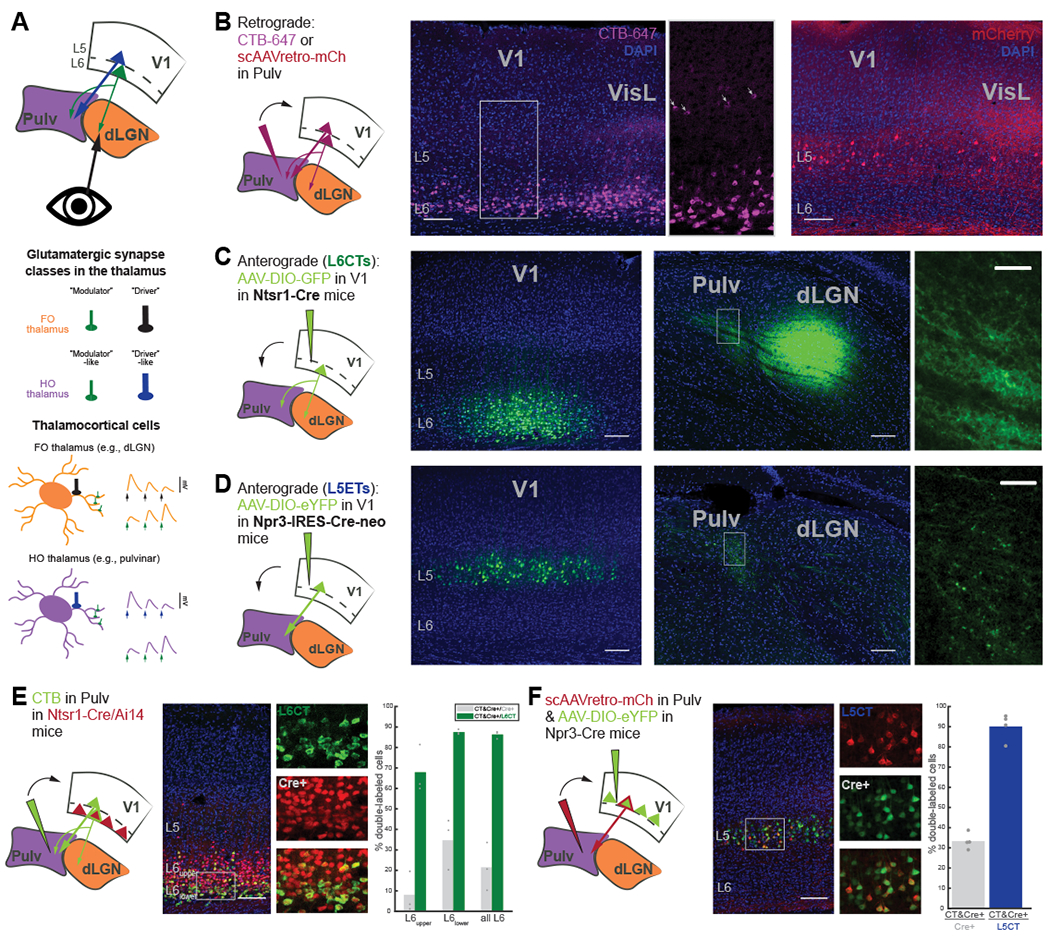
Figure 1. The mouse pulvinar receives V1 input from two distinct corticothalamic (CT) populations that are selectively targeted by different Cre mouse lines.

(A) Schematic of visual CT projections (top), different glutamatergic synapse classes (middle), and thalamocortical neurons in first-order (FO; e.g., dLGN) and higher-order (HO; e.g., pulvinar) thalamic nuclei (bottom) with characteristics of their different inputs (e.g., size, number and location of boutons, left; and short-term plasticity dynamics, right).
(B) Retrograde tracing from the pulvinar (left) with CTB-647 (middle) or a self-complimenting (sc)AAVretro-mCherry (right), with different tropisms for L6CTs versus L5CTs, respectively.
(C) AAV injection of Cre-dependent GFP into V1 of Ntsr1-Cre transgenic mice for L6CT labeling. Small, diffuse L6CT terminals are visible in the dLGN and pulvinar (far-right: higher magnification view of boxed region).
(D) AAV injection of Cre-dependent eYFP into V1 of Npr3-IRES-Cre-neo mice for labeling L5 extratelencephalic cells (L5ETs). L5 terminals are in the pulvinar but not the dLGN and appear larger and sparser than those from L6.
(E) Retrograde labeling (using CTB) from the pulvinar in Ntsr1-Cre/Ai 14 mice. Individual and composite channel images are from the boxed region. Right: Quantification of double-labeled cells out of all tdTomato+ cells (Cre+) and out of all CTB+ (L6CT) cells in L6upper, L6lower, and all of L6. n=3 mice.
(F) Retrograde labeling (using scAAVretro-mCherry) from the pulvinar in Npr3-Cre mice with AAV injection of Cre-dependent eYFP into V1. Right: quantification of double-labeled cells out of all eYFP+ cells (Cre+) and out of all mCherry+ cells (L5CT; n=4 mice).
All scale bars are 100μm for full images and 25μm for higher-magnification images (C, D). Bar graphs depict means across animals, and points are individual animals. See also Figure S1.
