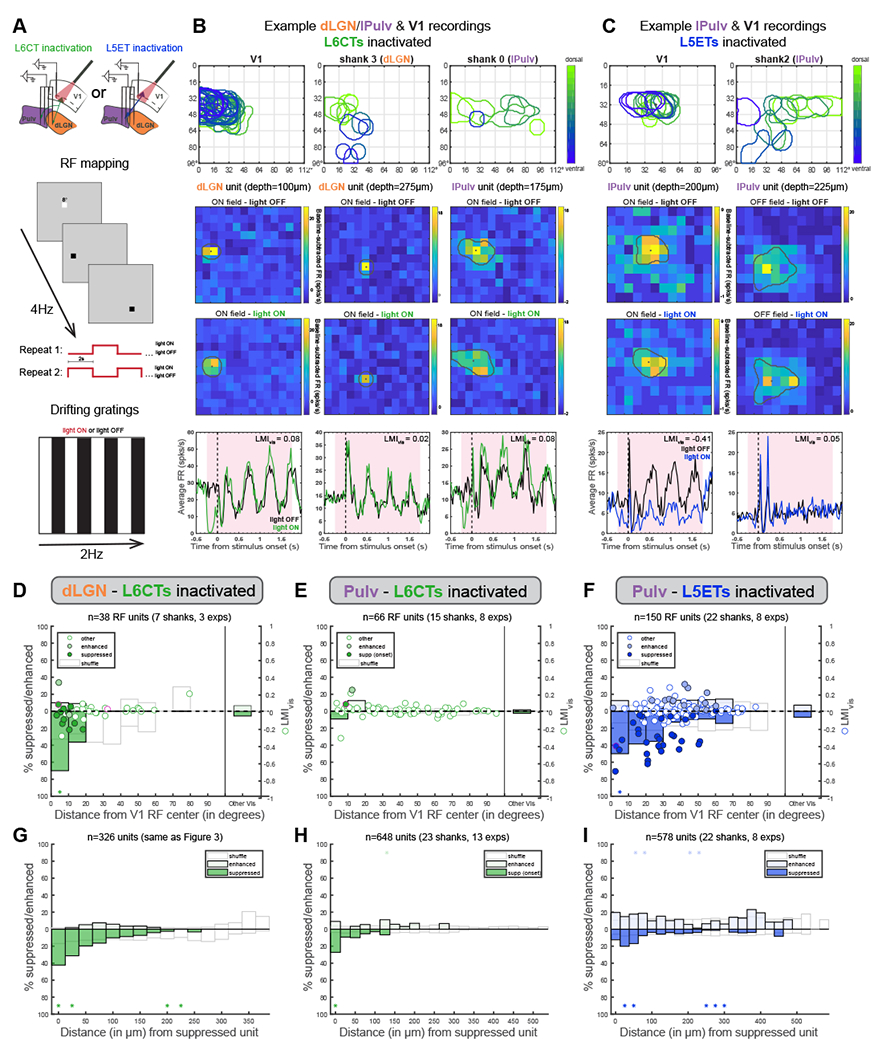
Figure 5. Corticothalamic excitation by both L6CTs and L5ETs is retinotopically organized.

(A) Schematics of V1 and thalamus recording configurations (top) and sparse noise (for receptive field mapping, middle) and drifting grating visual stimulation protocols (bottom).
(B) An example L6CT inactivation experiment in which V1, dLGN and lPulv were recorded from simultaneously. Top: overlayed ON-field RFs (in response to luminance increases) from recording shanks in V1, dLGN and lPulv, colored according to the unit’s relative depth within its respective region. Sparse noise stimuli (8° squares) were presented in a 12x14 grid. Middle: Example dLGN (first two columns) and lPulv (third column) units’ RFs without (top) and with (bottom) L6CTs inactivated, shown as baseline-subtracted FRs at the timepoint of peak response. “Depths” are relative to the most dorsal thalamic unit. Overlayed perimeters and dots indicate estimated RF outline and centroids (see Methods). Note that the first dLGN unit’s and the lPulv unit’s RFs overlap with the retinotopic location of V1 recording; the second dLGN unit does not. Bottom: PSTHs of the same units in response to drifting grating stimuli (as in Figure 3).
(C) Same as (B) but for a L5ET-inactivation experiment in which V1 and pulvinar were recorded from consecutively (10x12 grid for V1 recording, 12x14 for pulvinar).
(D) Relationship between light modulation (in drifting grating experiments) and retinotopic displacement from V1 recording site (i.e., the retinotopic locus of L6CT inactivation) from experiments in which sparse noise stimulation was used for both dLGN and V1 recordings. Dots indicate LMIvis (right y-axis) of enhanced, suppressed, and other cells (same as Figure 3 - classified from blank trials). Pink-outlined dots are the example units from (B). Bars indicate proportion of units significantly suppressed or enhanced (left y-axis), binned by retinotopic distance (10° bins). ‘Other Vis’ are all other units from the same experiments whose RFs could not be determined. White bars reflect means of 1000 shuffled distributions (shuffled within experiment).
(E) Same as (D) but for pulvinar units defined as “suppressed” from the prestimulus period following light onset (e.g., example pulvinar unit in B).
(F) Same as (D) but for pulvinar units during L5ET inactivation experiments.
(G) Percent of all unit pairs-consisting of two units, at least one of which was significantly suppressed, recorded on the same shank in the same experiment-in which the second unit was suppressed (lower half of graph) or enhanced (upper half), binned by vertical distance between the channels from which those units were recorded. White bars reflect means of 1000 shuffled distributions (shuffled separately for each recording shank). Asterisks indicate where actual proportions fell beyond either tail (2.5%) of shuffled distributions.
(H, I) Same as (G) but for pulvinar units in L6CT inactivation experiments (H; “onset suppressed” cells as in E) and pulvinar units in L5ET inactivation experiments (I). See also Figure S5 and S7
