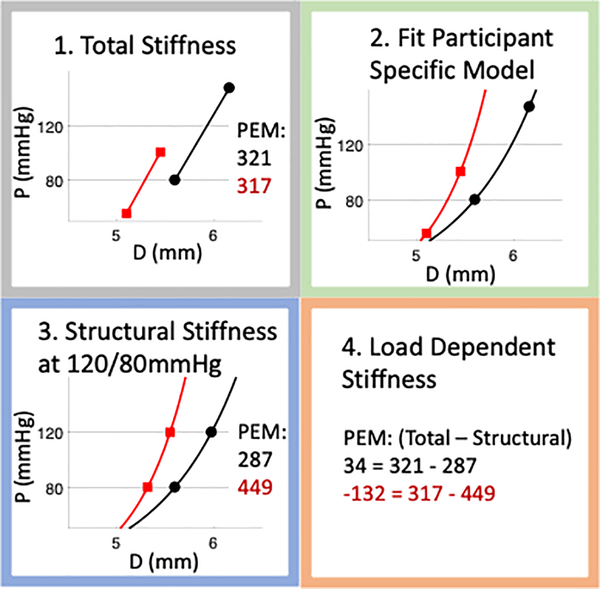
Figure 1:
Graphical representation of methods used to differentiate structural and load-dependent stiffness. Representative results are shown for two participants (one in red, one in black) who had similar total Peterson’s elastic modulus (PEM) (321 vs 317 mmHg), but via different mechanisms. One participant (red lines and text) had higher structural PEM (449 vs 287 mmHg) while the other participant (black lines and font) had higher load-dependent PEM (34 vs −132 mmHg). For graphs: the y axis label “P” is Pressure (mmHg), the x axis label “D” is Diameter (mm).

