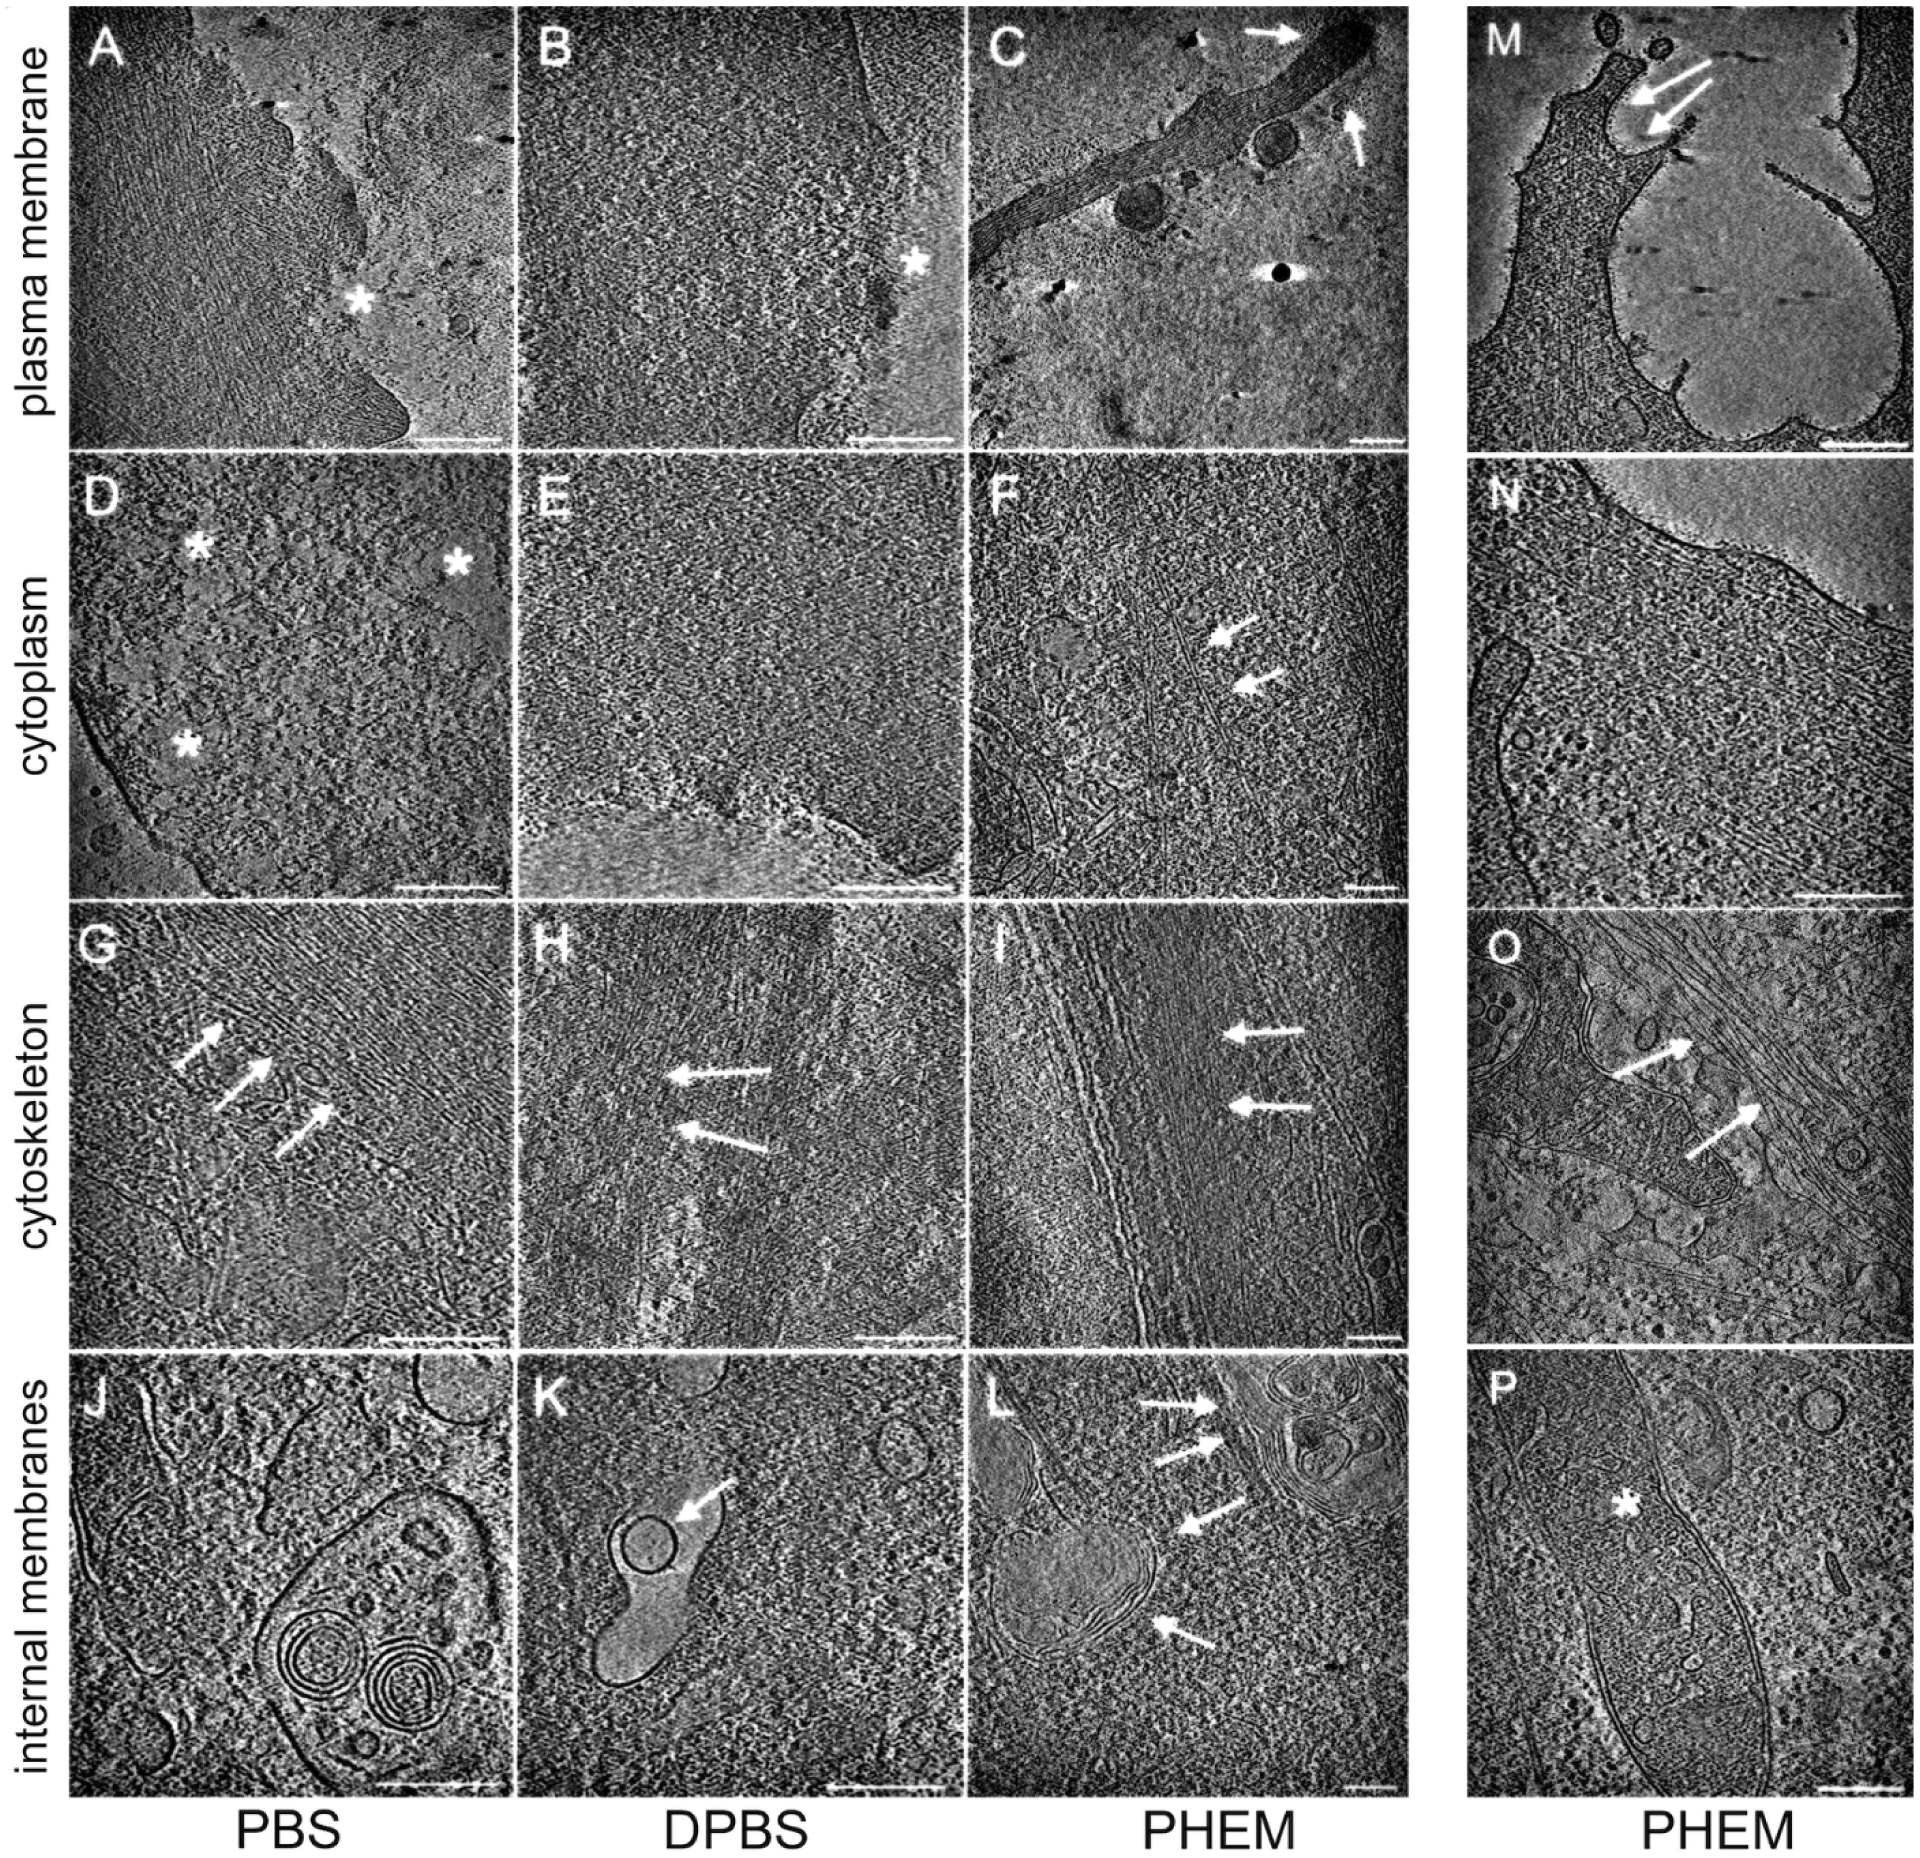
Figure 3. The composition of the buffer used affects the quality of preservation of the sample’s nanoarchitecture.

NIH 3T3 cells were grown on EMBRA finder grids, fixed and treated as described in PBS (A, D, G, J), DPBS (B, E, H, K), or PHEM (C, F, I, L) until vitrification. Following a similar preparation protocol, additional samples were generated for the PHEM condition, this time using THP-1 (M, N) and MEF (O, P) cells. Cryo-ET investigations focused on plasma membrane and neighboring areas (A, B, C, M; white asterisks in A and B point to damage to the plasma membrane and spillage of cellular matter into the extracellular environment; white arrows in C and M point to intact plasma membrane); cytoplasm (D, E, F, N; white asterisks in D mark areas void of discernible macromolecular assemblies; arrows in F point to actin filaments), areas rich in cytoskeletal elements (G, H, I, O; actin filaments, white arrows); areas with membranous compartment (white arrows in J, K and L) and mitochondria (white asterisk in P). Scale bars, 200 nm.
