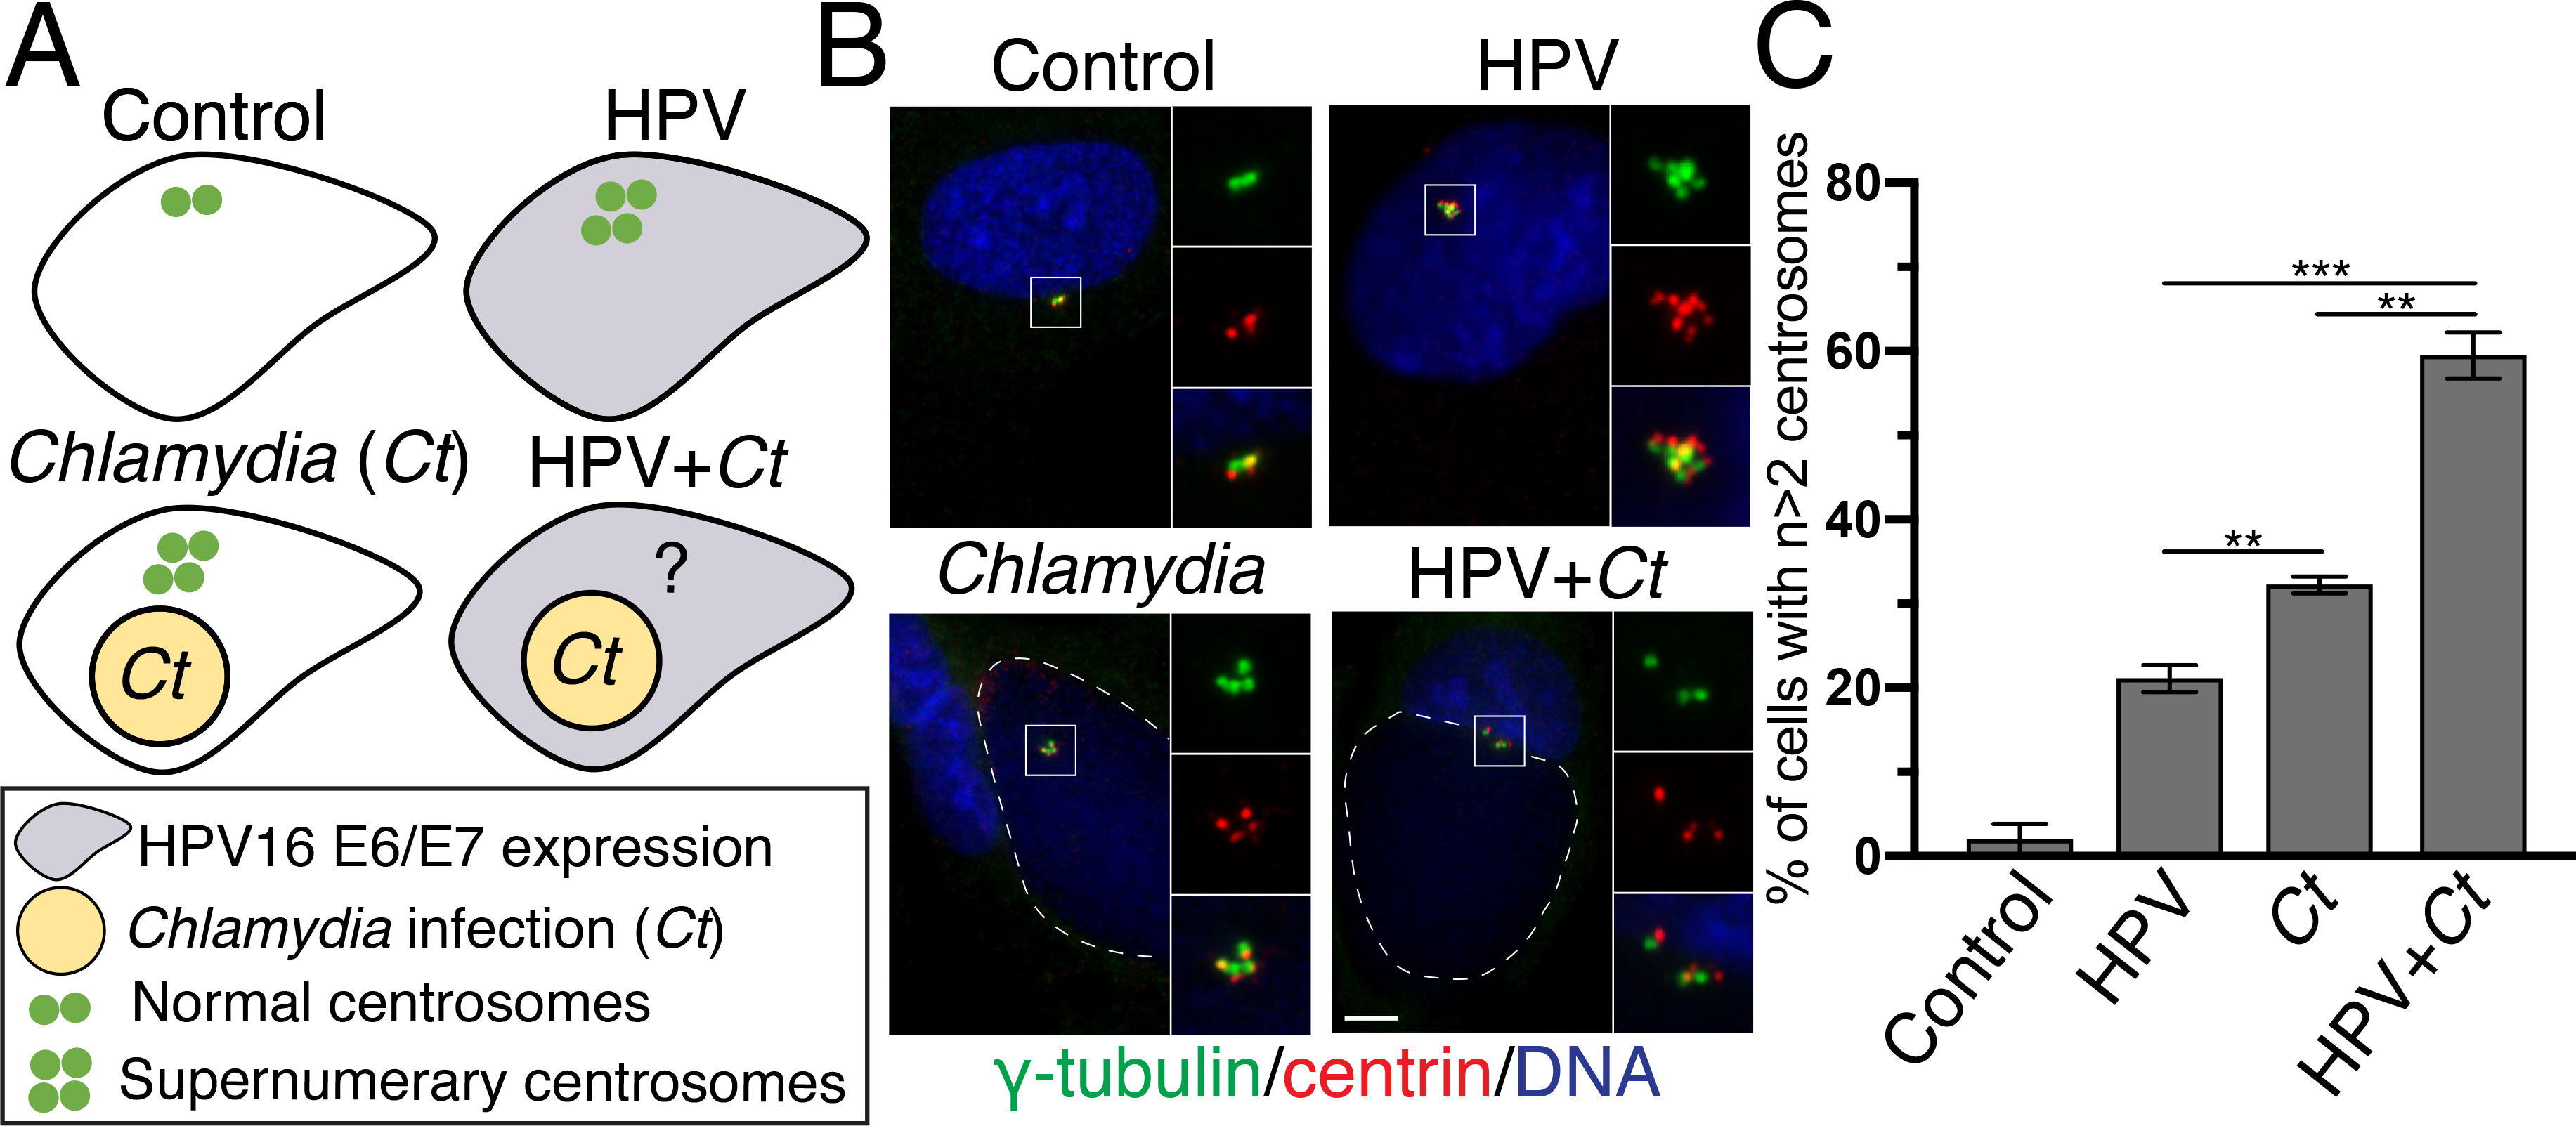
Figure 1. Chlamydia and HPV have additive effects on the host cell centrosome.

(A) Schematic representation of the experimental design to study the separate and combined effect of Chlamydia and HPV on the centrosome. Control cells are RPE-1 cells transfected with an empty plasmid. “HPV cells” are RPE-1 cells that stably express HPV16 oncoproteins E6 and E7 (gray cell). “Chlamydia cells” are RPE-1 cells infected with Chlamydia trachomatis (yellow circle), while “HPV+Chlamydia” cells are RPE-1 cells that stably express HPV16 oncoproteins and that are infected with C. trachomatis. Individual centrosomes are presented as green dots.
(B) Control RPE-1 cells or HPV cells, grown on coverslips, were either mock-infected or infected with C. trachomatis L2 at an MOI of 3. Samples were fixed at 36 hours post infection (hpi). Centrosomes were visualized with antibodies to γ-tubulin (green) and centrin (red), host and chlamydial DNA was detected with DAPI (blue). Chlamydial inclusions are outlined with white dashed lines. Scale bar: 5 μm.
(C) The percentage of host cells with supernumerary centrosomes (n>2 centrosomes) from the four different conditions is shown. 100 cells were analyzed for each condition. For the samples with a Chlamydia infection, only infected cells were examined and quantified. Data are represented as mean ± SD (n=3); **P≤0.01 and ***P<0.001.
