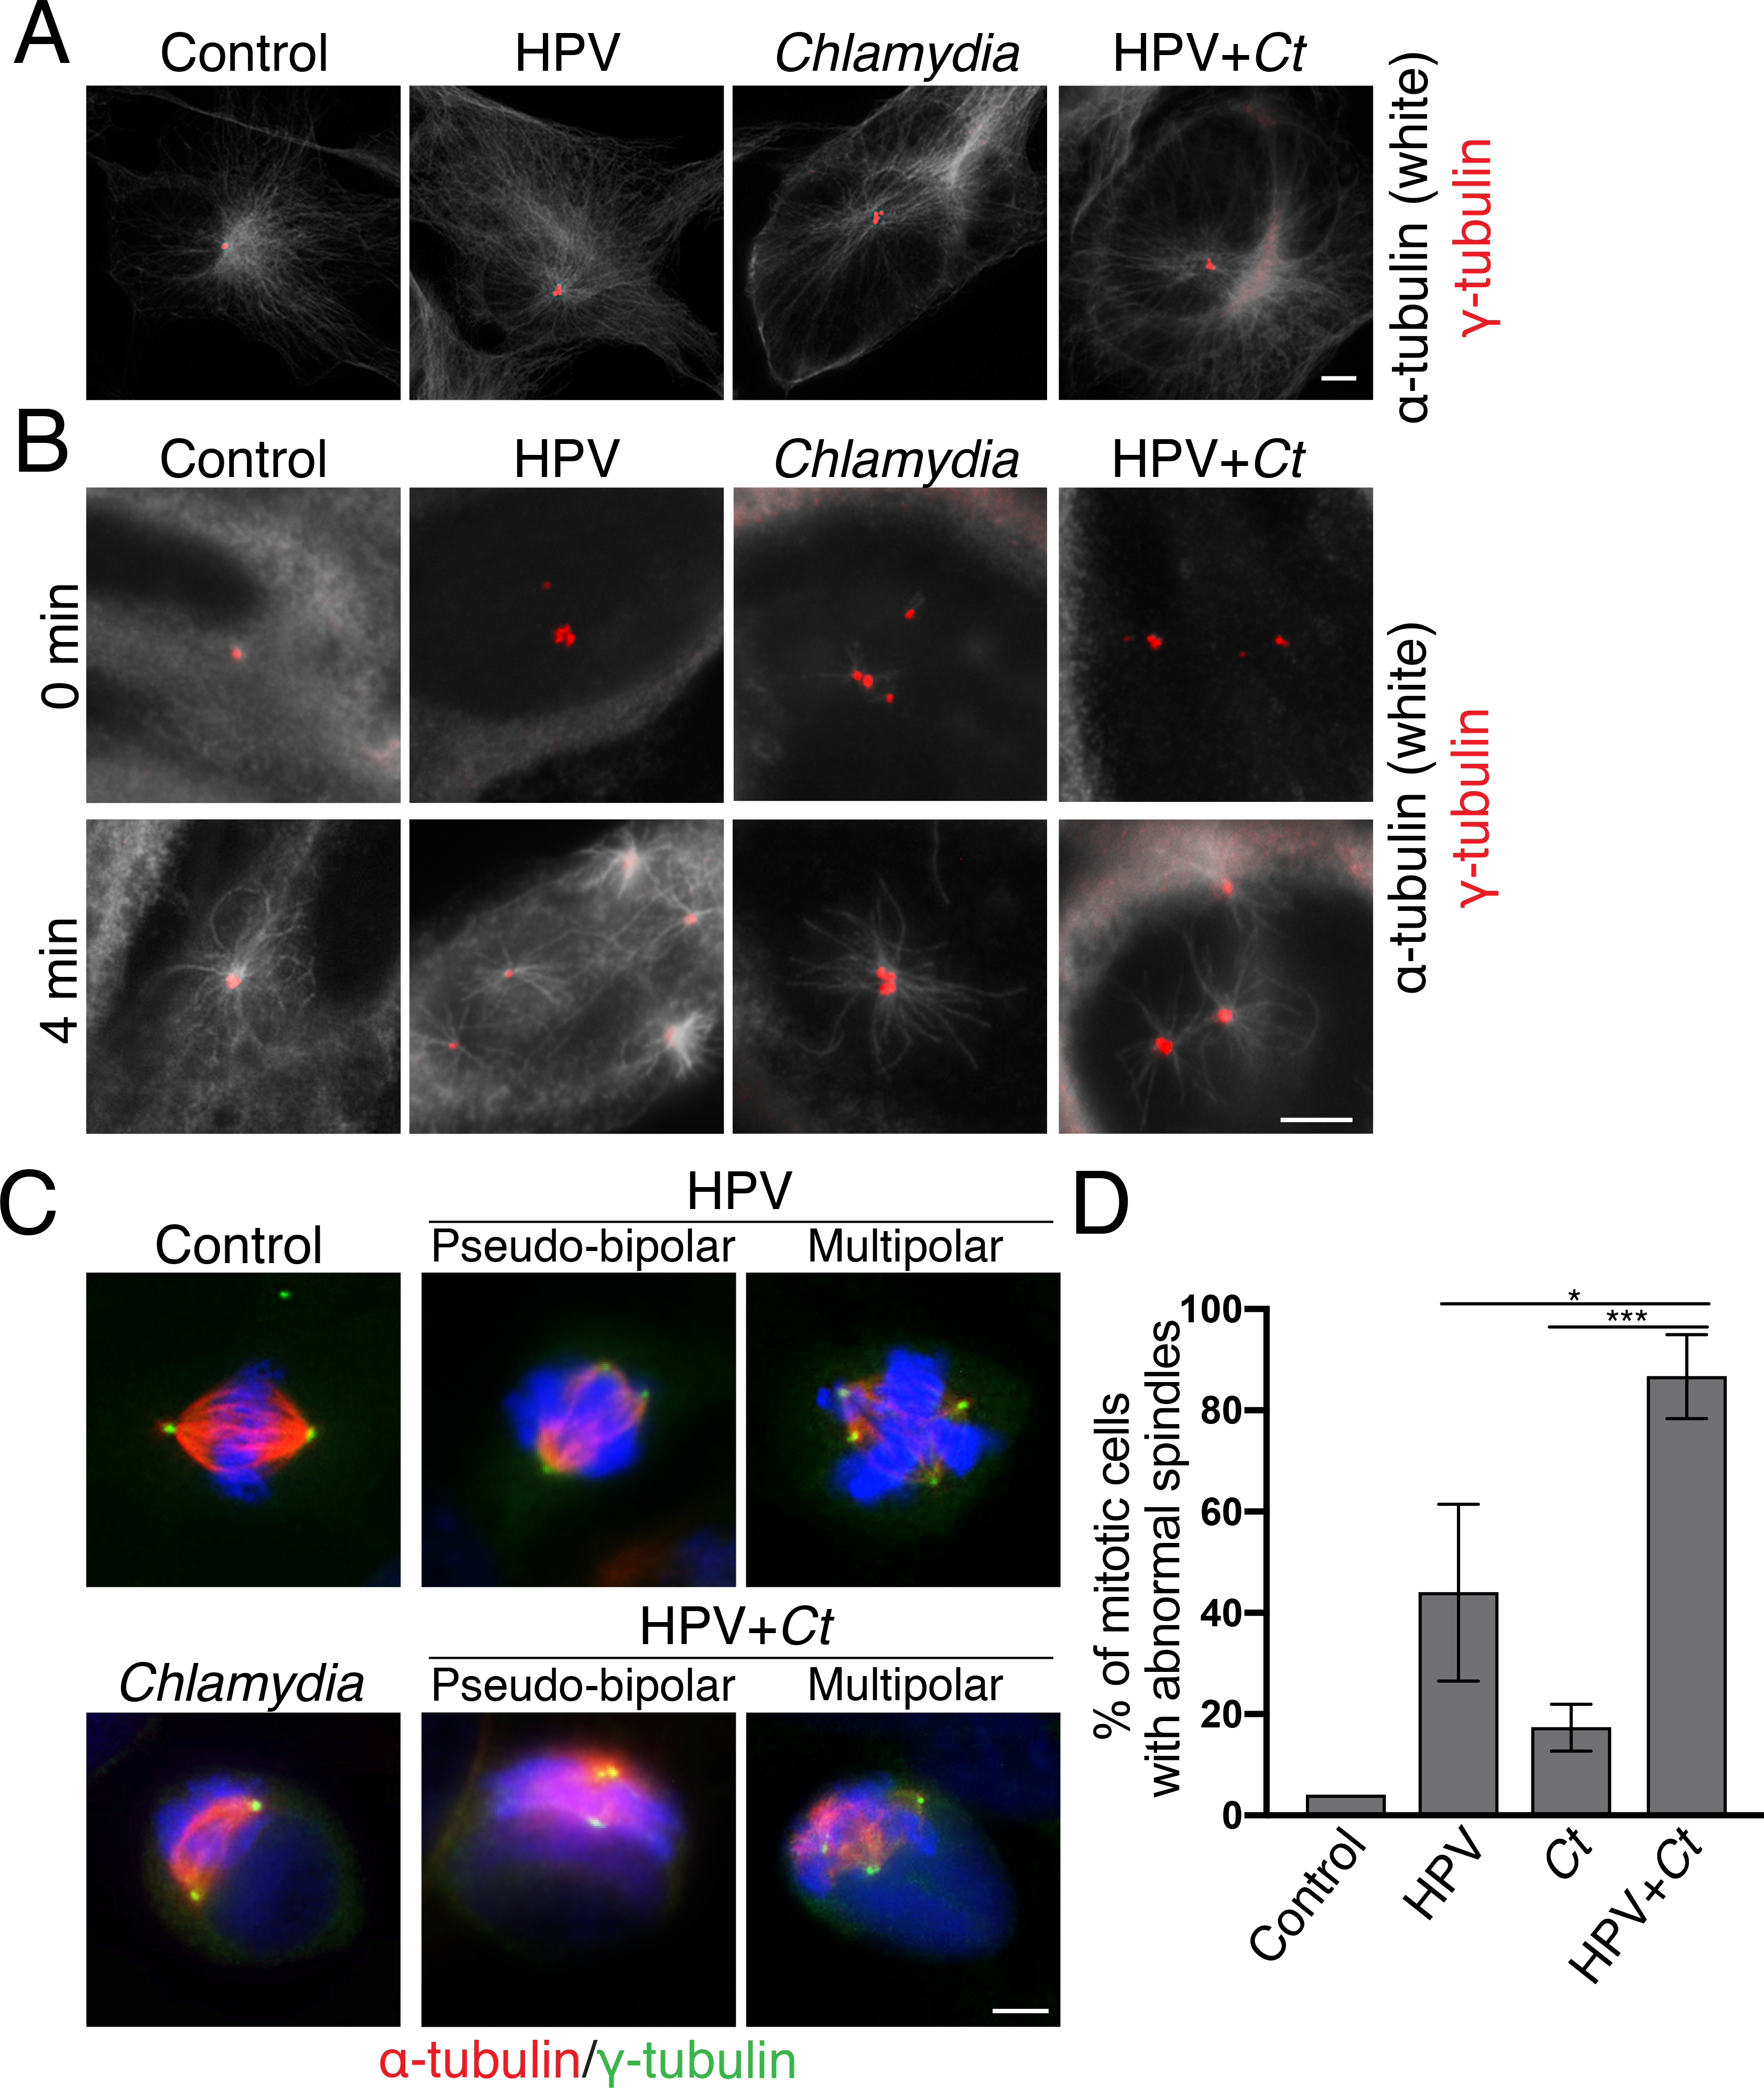
Figure 2. Centrosome amplification does not disrupt centrosome function.

(A) Immunofluorescence images of mock or Chlamydia-infected RPE-1 or HPV cells fixed at 36hpi in interphase. Microtubules were visualized with α-tubulin antibodies (white) and centrosomes were detected with γ-tubulin antibodies (red). Scale bar: 5μm.
(B) Microtubule regrowth assays are shown for cells of each of the four experimental conditions. Cells were incubated on ice to depolymerize microtubules (0 min) and then shifted to 37°C for 4 minutes to allow microtubule nucleation and polymerization (4 min). Cells were fixed at the indicated time points and analyzed by immunofluorescence microscopy, detecting microtubules and centrosomes as described in (A). Scale bar: 5μm.
(C) Immunofluorescence images of mitotic cells in the samples in (A). Mitotic spindles were identified with antibodies to α-tubulin antibodies (red) and centrosomes were visualized with γ-tubulin antibodies (green). DNA was visualized with DAPI (blue). Scale bar: 5μm.
(D) The percentage of mitotic cells with abnormal spindles in each of the four conditions is shown. Both pseudo-bipolar (centrosome clustering) and multipolar spindles were considered abnormal. 50 mitotic cells were analyzed for each condition. For the samples with a Chlamydia infection, only infected cells were examined and quantified. Data are represented as mean ± SD (n=3); *P≤0.05 and ***P<0.001.
