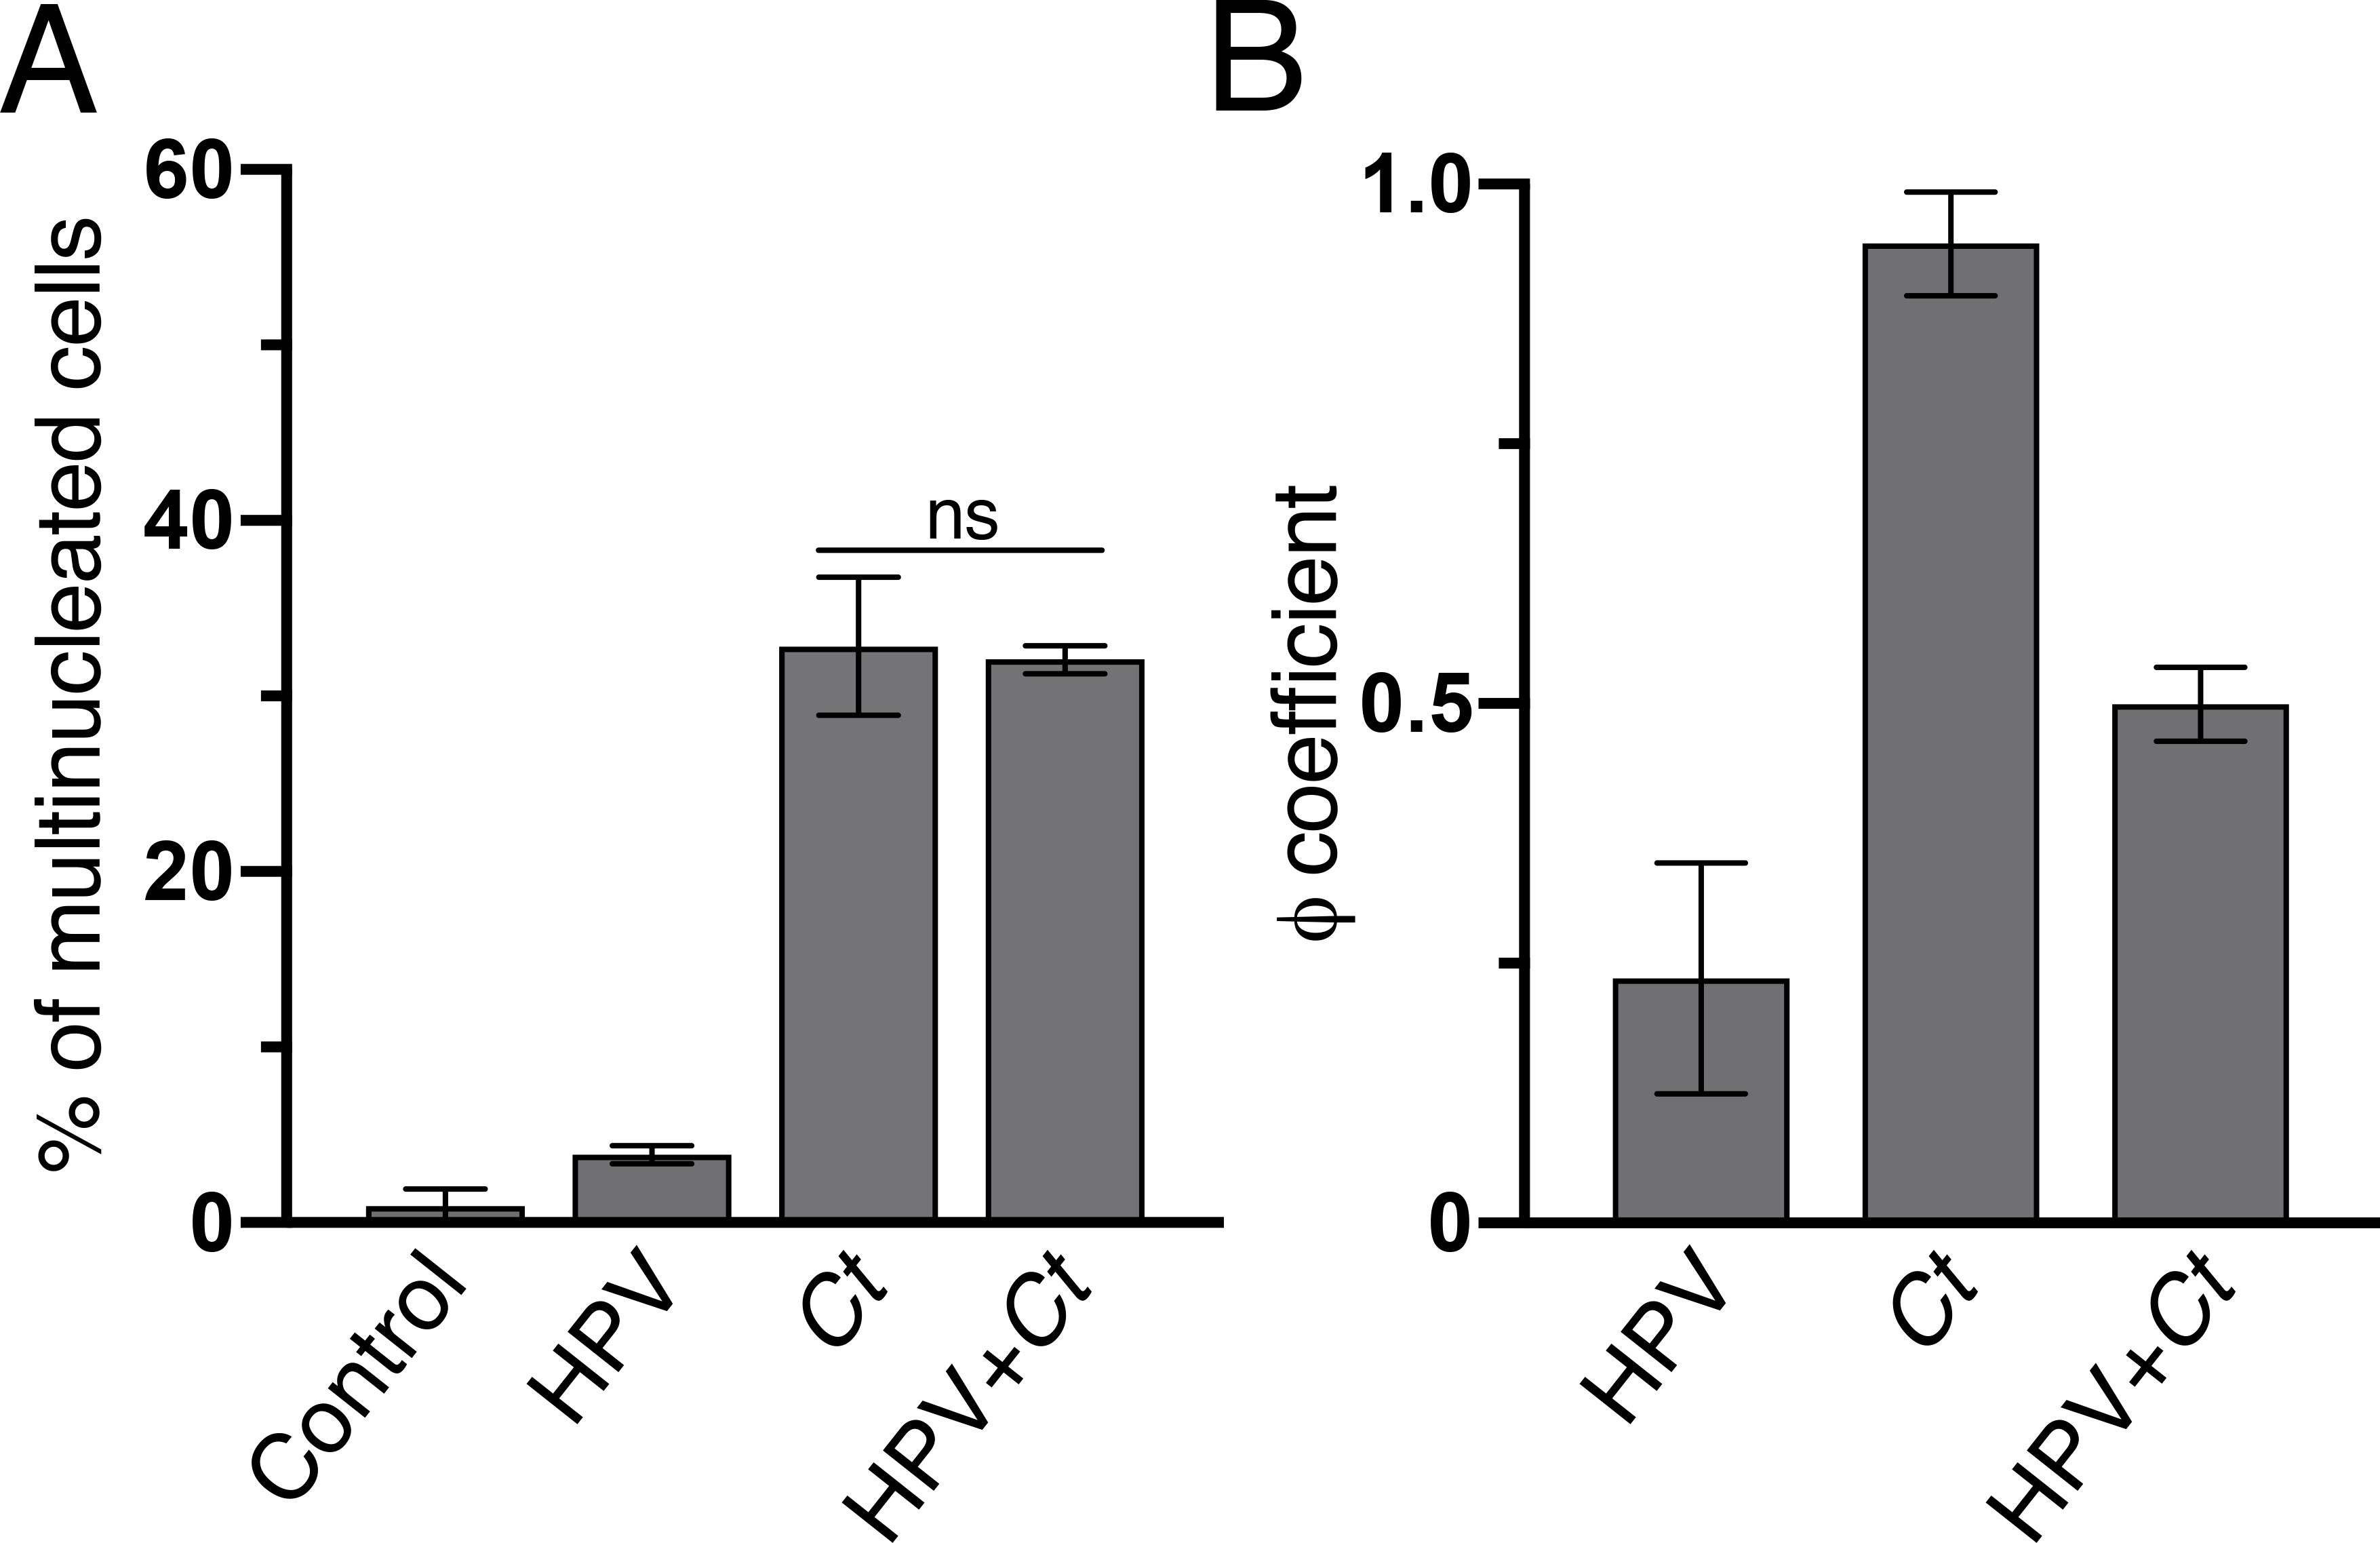
Figure 3. Multinucleation is strongly correlated with centrosome amplification in Chlamydia cells but not in HPV cells.

(A) The percentage of multinucleated host cells described in Figure 1C is shown. 100 cells were examined for each condition. For Chlamydia cells, only infected cells were counted. Data are shown as mean ± SD (n=3); ns: not statistically significant.
(B) ϕ coefficients between multinucleation and centrosome amplification were calculated for the HPV, Chlamydia, and HPV+Chlamydia cells of Figure 1C. ϕ coefficients range from −1 to 1, with −1 or +1 indicating perfect negative or positive relationships, respectively, while 0 shows no relationship between the two phenotypes. The control sample was not included due to low level of centrosome amplification in these cells. Data are shown as mean ± SD (n=3).
