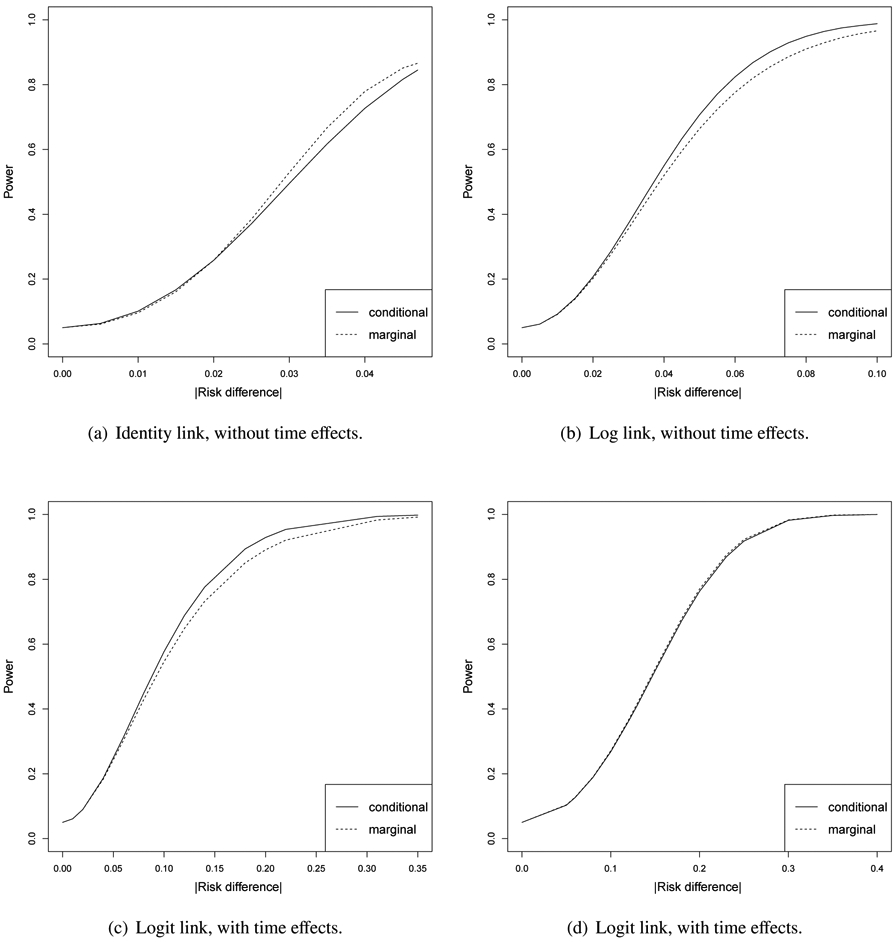
Figure A.1:

Power vs. the absolute value of risk difference between the control and intervention group at the end of the cross-sectional study, for I = 6, J = 3, K = 40, and α0 = α1 = 0.02. There are no time effects in the first row. Figure A.1 has the identity link and the baseline mean response in the control group of 0.05. The conditional model has a slightly larger power when the absolute value of risk difference is smaller, the opposite conclusion is shown when the absolute value of risk difference is larger. Figure A.1 has the log link and the baseline mean response in the control group of 0.045. The conditional and marginal models have almost the same power when risk difference is smaller, and conditional model has a larger power when risk difference increases. The second row considers time effects and the logit link. In Figure A.1, the baseline mean response in the control group is 0.03 and the mean response in the control group at the end of the study is 0.04. The conditional model has a larger power as risk difference increases. In Figure A.1, the baseline mean response in the control group is 0.3 and the mean response in the control group at the end of the study is 0.4. The marginal model has a larger power as risk difference increases.
