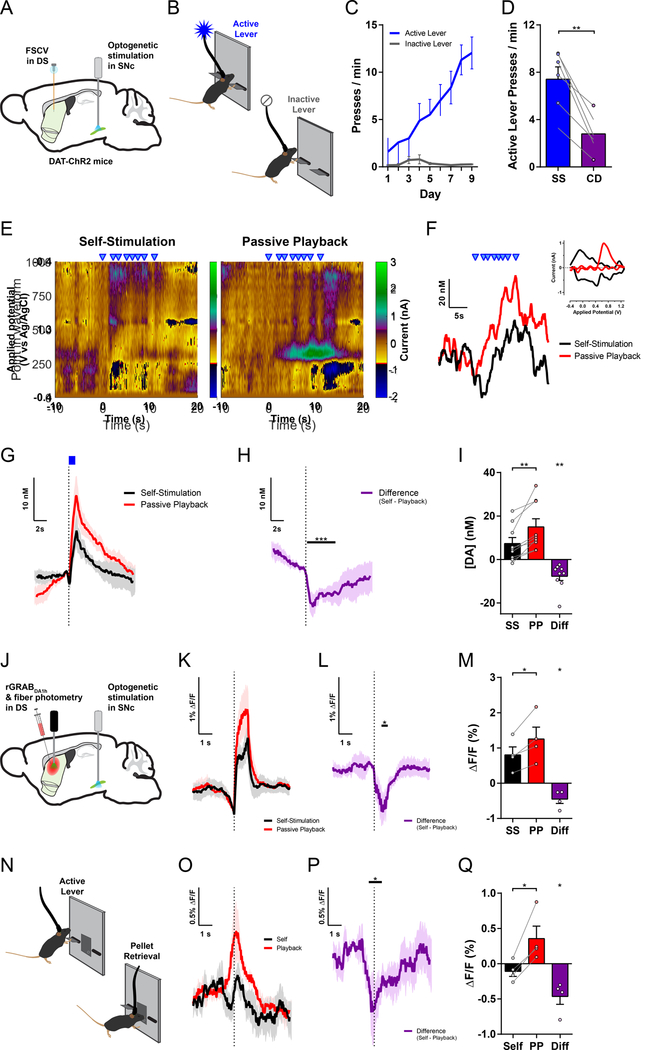
Figure 1. Goal-directed action suppresses nigrostriatal dopamine release.
(A) Schematic of experimental preparation for optogenetic stimulation of SNc dopamine neurons and FSCV recording in dorsal striatum.
(B) Opto-ICSS behavioral task schematic.
(C) Acquisition of opto-ICSS (n = 9 mice; two-way repeated-measures ANOVA: main effect of Lever, F1,8 = 16.84, P = 0.0034; main effect of Day, F8,64 = 9.314, P < 0.0001; Lever by Day interaction, F8,64 = 10.63, P < 0.0001; Active Lever significantly greater than Inactive Lever for Days 4–9, Ps ≤ 0.008).
(D) Contingency degradation test: 30 min of opto-ICSS followed by 30 min contingency degradation test phase (n = 6 mice; paired t test, t5 = 5.441, P = 0.0028).
(E) Representative voltammetric pseudocolor plots from a bout of stimulations (blue triangles) during the Self-Stimulation phase (left) and the matched stimulations from the Passive Playback phase (right).
(F) Dopamine responses to the series of stimulations in each session phase from the example in (E). Inset: cyclic voltammograms.
(G) Mean change in dopamine concentration evoked by Self-Stimulation and Passive Playback stimulations (n = 9 mice).
(H) Difference trace: Self-Stimulation minus Passive Playback, from traces in (G). Black bar indicates post-stimulation time points with significant difference vs. 0 (permutation test, P = 0.0001).
(I) Mean change in dopamine concentration (Self-Stimulation vs. Passive Playback, paired t test, t8 = 3.923, P = 0.0044; equivalently, Difference vs. 0 one-sample t test: t8 = 3.923, P = 0.0044).
(J) Schematic of experimental preparation for fiber photometry recordings of the red fluorescent dopamine sensor rGRABDA1h in the dorsal striatum with optogenetic stimulation of SNc dopamine neurons.
(K) Mean ΔF/F rGRABDA1h dopamine sensor response in dorsomedial striatum (DMS) evoked by Self-Stimulation and Passive Playback stimulations (n = 4 mice).
(L) Difference trace: Self-Stimulation minus Passive Playback, from traces in (K). Black bar, permutation test, P = 0.0221.
(M) Mean ΔF/F rGRABDA1h dopamine sensor response (Self-Stimulation vs. Passive Playback paired t test, and Difference vs. 0 one-sample t test: t3 = 3.580, P = 0.0373).
(N) Sucrose pellet CRF behavioral task schematic.
(O) Mean ΔF/F rGRABDA1h dopamine sensor response aligned to sucrose pellet retrieval (1st head entry following reward delivery; n = 4 mice).
(P) Difference trace: Self minus Playback, from traces in (N). Black bar, permutation test, P = 0.0196.
(Q) Mean ΔF/F rGRABDA1h dopamine sensor response to pellet retrieval (Self vs. Playback paired t test, and Difference vs. 0 one-sample t test: t3 = 4.127, P = 0.0258).
FSCV, fast-scan cyclic voltammetry; DS, dorsal striatum; SNc, substantia nigra pars compacta; SS, Self-Stimulation; CD, Contingency Degradation; PP, Passive Playback; Diff, Difference (Self minus Playback). All error bars are SEM, same for below unless stated otherwise. See also Figure S1.

