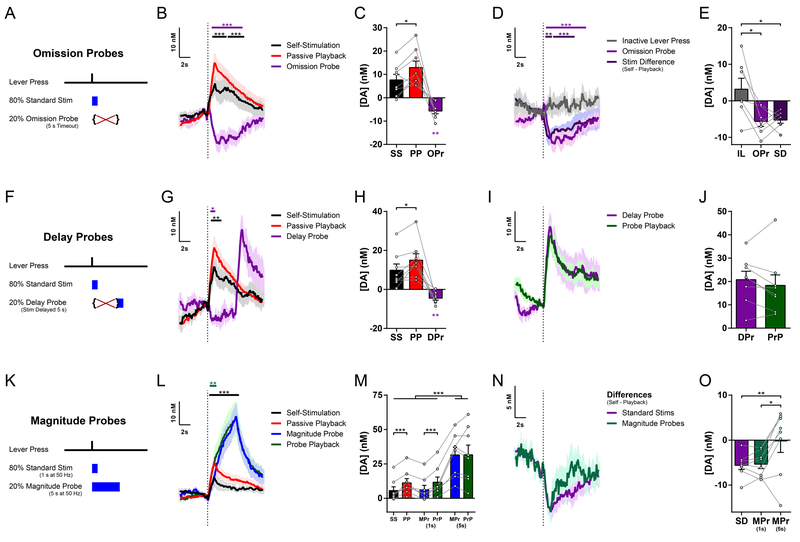
Figure 2. The inhibition of dopamine is action-specific and temporally precise.
(A) Task schematic for Omission Probe FSCV sessions.
(B) Mean change in dopamine concentration for stimulations and probes in Omission Probe sessions (n = 8 mice; permutation tests: Omission Probe vs. 0, magenta bar, P = 0.0001; Self-Stimulation vs. Playback, black bar, P = 0.0003 for first time cluster and P = 0.0001 for second cluster).
(C) Mean change in dopamine concentration in Omission Probe sessions (Self-Stimulation vs. Passive Playback, paired t test, t7 = 3.114, P = 0.0170; Omission Probe vs. 0, one-sample t test: t7 = 4.810, P = 0.0019).
(D) Mean change in dopamine concentration for Inactive Lever presses, overlaid on Omission Probes from (B) and Difference traces (Self Stimulation minus Playback) from Fig. 1H (n = 7 mice; permutation tests: Inactive press vs. Omission Probe, magenta bar, P = 0.0001; Inactive press vs. Stim Difference, purple bar, P = 0.007 for first time cluster and P = 0.0007 for second cluster.
(E) Mean change in dopamine concentration for Inactive Lever presses versus Omission Probes from (C) and stimulation Differences from Fig. 1I (one-way repeated-measures ANOVA, F2,12 = 7.419, P = 0.0080; Tukey’s multiple comparisons tests: Inactive Lever vs. Omission Probe, P = 0.0133; Inactive Lever vs. Stimulation Difference, P = 0.0174).
(F) Task schematic for Delay Probe FSCV sessions.
(G) Mean change in dopamine concentration for Standard Stimulations and probes in Delay Probe sessions (n = 8 mice; permutation tests: Delay Probe timeout period vs. 0, magenta bar, P = 0.0103; standard Self-Stimulation vs. Playback, black bar, P = 0.0001).
(H) Mean change in dopamine concentration in Delay Probe sessions (Self-Stimulation vs. Passive Playback, paired t test, t7 = 2.962, P = 0.0210; Delay Probe vs. 0, one-sample t test: t7 = 4.341, P = 0.0034).
(I) Mean change in dopamine concentration for Delay Probes and Probe Playback, each aligned to stimulation onset.
(J) Mean change in dopamine concentration for Delay Probe stimulation and Probe Playback.
(K) Task schematic for Magnitude Probe FSCV sessions.
(L) Mean change in dopamine concentration for standard stimulations and probes in Magnitude Probe sessions (n = 8 mice; permutation tests: Magnitude Probe vs. Probe Playback, teal bar, P = 0.0052; standard Self-Stimulation vs. Playback, black bar, P = 0.0001).
(M) Mean change in dopamine concentration in Magnitude Probe sessions (two-way repeated-measures ANOVA: main effect of Session Phase (Self vs. Playback), F1,7 = 6.769, P = 0.0353; main effect of Stimulation Type (Standard, early and late Magnitude Probe), F2,14 = 31.32, P < 0.0001; Session Phase by Stimulation Type interaction, F2,14 = 7.724, P = 0.0055; Sidak’s multiple comparisons tests: late Magnitude Probes vs. Standard Stimulations and vs. early Magnitude Probes within both Self and Playback phases, all Ps < 0.0001; Self vs. Playback for Standard Stimulations, P = 0.0006; Self vs. Playback for early Magnitude Probes, P = 0.0008).
(N) Difference traces: Self-Stimulation minus Passive Playback for Standard Stimulations and Magnitude Probes, from traces in (L).
(O) Mean Differences comparing session phases (Self-Stimulation minus Passive Playback) for Standard Stimulations and Magnitude Probes at early (1 s) and late (5 s) time points from Difference traces in (N). (One-way repeated-measures ANOVA, F2,14 = 7.653, P = 0.0057; Tukey’s multiple comparisons tests: Standard Stimulation Differences vs. late Magnitude Probe Differences, P = 0.0099; early vs. late Magnitude Probe Differences, P = 0.0136).
SS, Self-Stimulation; PP, Passive Playback; OPr, Omission Probe; IL, Inactive Lever; SD, Standard Stimulation Difference (Self minus Playback); DPr, Delay Probe; PrP, Probe Playback; MPr, Magnitude Probe. See also Figure S2.

