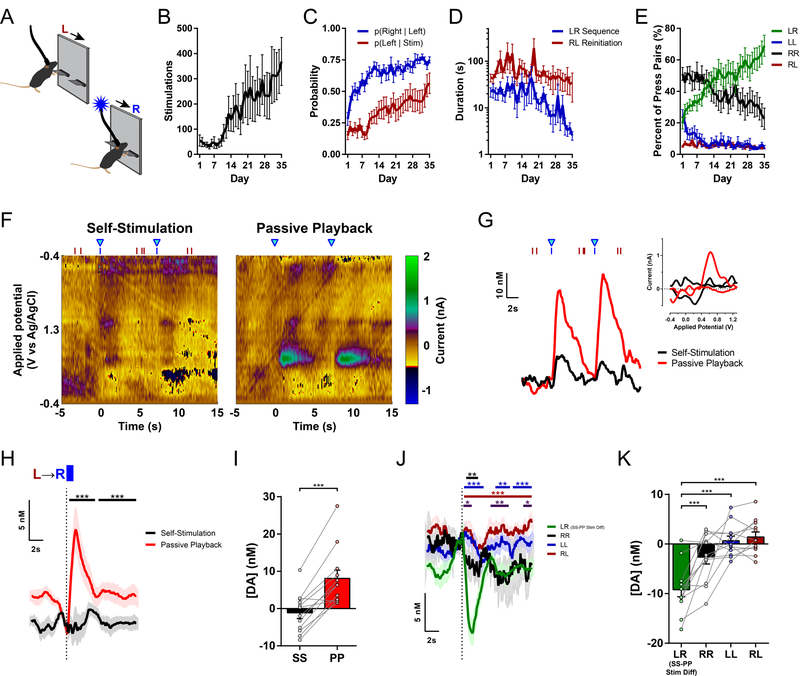
Figure 3. Sequence-specific inhibition of nigrostriatal dopamine during performance of learned LR sequence.
(A) Left-Right Sequence Self-Stimulation task schematic.
(B) Stimulations earned across days of training (n = 13 mice; one-way repeated-measures ANOVA: F34,408 = 3.550, P < 0.0001).
(C) Transition probabilities: probability of pressing Right lever after each Left lever press, and probability of reinitiating Left press after stimulation (two-way repeated-measures ANOVA: main effect of Day, F34,408 = 8.838, P < 0.0001; main effect of Transition Type, F1,12 = 47.18, P < 0.0001; Dunnett’s multiple comparisons tests vs. Day 1: p(Right | Left) first significantly differs on Day 3, P = 0.0266; p(Left | Stim) first significantly differs on Day 14, P = 0.0265).
(D) Median latencies to complete Left-Right sequences and to reinitiate a new sequence after previous stimulation (two-way repeated-measures ANOVA: main effect of Interval Type, F1,12 = 18.79, P = 0.0010).
(E) Relative frequency of each combination of lever press pairs (two-way repeated-measures ANOVA: main effect of Pair Type, F3,36 = 32.58, P < 0.0001; Pair Type by Day interaction, F102,1224 = 4.315, P < 0.0001).
(F) Representative voltammetric pseudocolor plots during two Left-Right sequences for optogenetic intracranial Self-Stimulation (left) and corresponding stimulations from the Passive Playback phase (right).
(G) Dopamine responses to the stimulations depicted in (F). Red and blue ticks denote left and right lever presses, respectively. Inset: cyclic voltammograms evoked by the first stimulation.
(H) Mean dopamine concentration changes evoked by stimulation in each phase (n = 12 mice; permutation test, Ps = 0.0001 for both time clusters).
(I) Mean change in dopamine concentration (paired t test, t11 = 6.403, P < 0.0001).
(J) Mean dopamine concentration changes evoked by non-stimulated pairs of lever presses (5-s maximum inter-press interval within pair). Traces are aligned to the second press in each pair type. The LR sequence stimulation Difference (Self-Stimulation minus Passive Playback) is overlaid for comparison (green). (Permutation tests: LR Stim Difference vs. RR, black bar, P = 0.0046; LR Stim Difference vs. LL, blue bars, Ps = 0.0002 for first time cluster, 0.0017 for second, and 0.0007 for third cluster; LR Stim Difference vs. RL, maroon bar, P = 0.0001; RR vs. RL, purple bars, Ps = 0.0185 for first time cluster, 0.0021 for second, and 0.0163 for third cluster).
(K) Mean change in dopamine concentration for each combination of non-reinforced press pairs during the Self-Stimulation phase, and the LR sequence stimulation Difference (Self minus Playback). (One-way repeated-measures ANOVA, F3,33 = 20.34, P < 0.0001; Tukey’s multiple comparisons tests: LR Stim Difference vs. RR, P = 0.0007; LR Stim Difference vs. LL and vs. RL, Ps < 0.0001; one-sample t tests of each combination vs. 0: RR, t11 = 1.919, P = 0.0813; LL, t11 = 0.6952, P = 0.5013; RL, t11 = 1.434, P = 0.1795; LR Stim Difference, t11 = 6.401, P < 0.0001).
Stim, Stimulation; LR, Left-Right sequence; RR, Right-Right; LL, Left-Left; RL, Right-Left; SS, Self-Stimulation; PP, Passive Playback; Diff, Difference. See also Figure S3.

