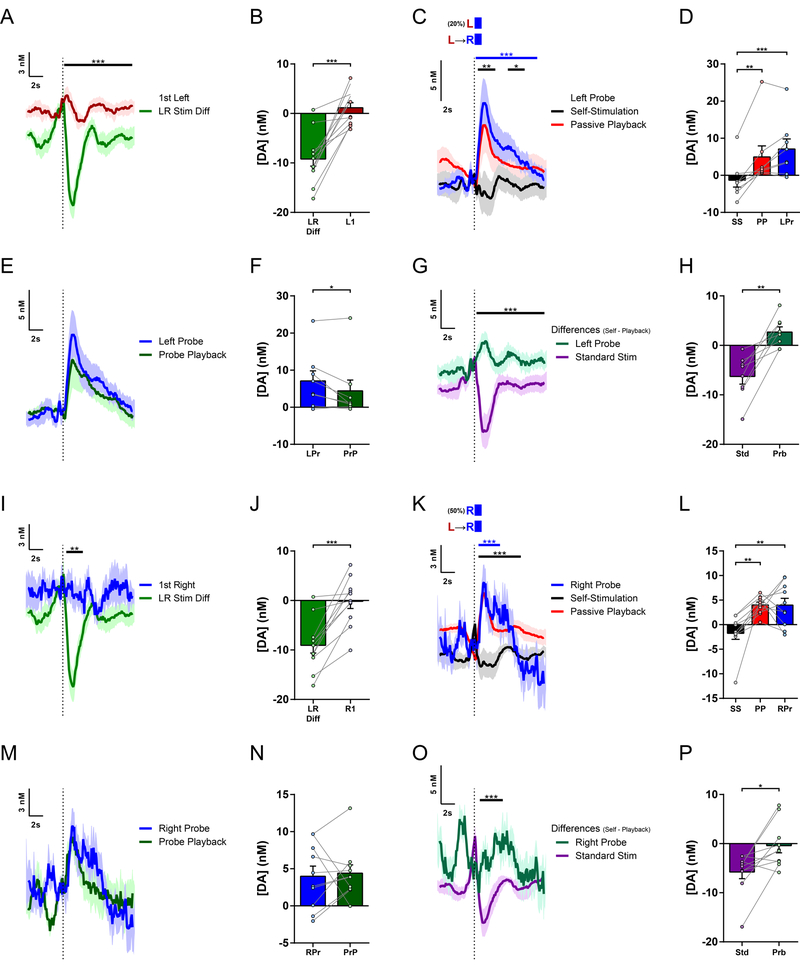
Figure 4. Different regulation of dopamine by individual actions of the LR sequence.
(A) Mean dopamine concentration change to first Left lever press following previous stimulation during Left-Right sequence task performance, overlaid with the Difference Trace (Self minus Playback) for LR sequence stimulations from Fig. 3J for comparison (n = 12 mice; permutation test, P = 0.0001).
(B) Mean change in dopamine concentration for first Left lever presses and LR sequence stimulation Difference (t11 = 6.325, P < 0.0001).
(C) Mean dopamine concentration changes in Left-Right sequence sessions with Left Lever Probes (n = 8 mice; permutation tests: Left Probe vs. Standard LR Self-Stimulation, blue bar, P = 0.0001; Standard LR Self-Stimulation vs. Playback, black bars, Ps = 0.0049 for first and 0.011 for second time clusters, respectively).
(D) Mean change in dopamine concentration in Left Probe sessions (one-way repeated-measures ANOVA, F2,14 = 17.19, P = 0.0002; Tukey’s multiple comparisons tests: Left Probe vs. LR Self-Stimulation, P = 0.0002; LR Self-Stimulation vs. Playback, P = 0.0024).
(E) Mean dopamine concentration changes in Left Probes and the Probe Playback.
(F) Mean change in dopamine concentration to Left Probes and Probe Playback (paired t test, t7 = 2.519, P = 0.0399).
(G) Difference traces from Left Probe Sessions: Self-Stimulation minus Passive Playback for Standard LR Stimulations and Left Probes, from traces in (C) and (E); (permutation test, P = 0.0001).
(H) Mean Differences comparing session phases (Self-Stimulation minus Passive Playback) for Standard LR Stimulations and Left Probes (paired t test, t7 = 5.125, P = 0.0014).
(I) Mean dopamine concentration change to first Right lever press following previous stimulations, overlaid with the Difference Trace (Self minus Playback) for LR sequence stimulations from Fig. 3J for comparison. First Right press was an additional press on the Right lever after a previous stimulation, without approaching the Left lever (n = 11 mice; permutation test, P = 0.0012).
(J) Mean change in dopamine concentration for first Right lever presses and LR sequence stimulation Difference (t10 = 5.690, P = 0.0002).
(K) Mean dopamine concentration changes in Left-Right sequence sessions with Right Lever Probes where animal did not approach the Left lever in the preceding inter-stimulation interval (n = 10 mice; permutation tests: Right Probe vs. Standard LR Self-Stimulation, blue bar, P = 0.0001; Standard LR Self-Stimulation vs. Playback, black bar, P = 0.0001).
(L) Mean change in dopamine concentration in Right Probe sessions (one-way repeated-measures ANOVA, F2,18 = 10.47, P = 0.0010; Tukey’s multiple comparisons tests: Right Probe vs. LR Self-Stimulation, P = 0.0026; LR Self-Stimulation vs. Playback, P = 0.0024).
(M) Mean dopamine concentration changes in Right Probes and the Probe Playback.
(N) Mean change in dopamine concentration to Right Probes and Probe Playback.
(O) Difference traces from Right Probe Sessions: Self-Stimulation minus Passive Playback for Standard LR Stimulations and Right Probes, from traces in (K) and (M); (permutation test, P = 0.0002).
(P) Mean Differences comparing session phases (Self-Stimulation minus Passive Playback) for Standard LR Stimulations and Right Probes (paired t test, t9 = 3.080, P = 0.0131).
LR Stim Diff, Left-Right Stimulation Difference (Self minus Playback); L1, 1st Left Press; R1, 1st Right Press; SS, Self-Stimulation; PP, Passive Playback; LPr, Left Probe; PrP, Probe Playback; Std, Standard LR Stimulation; Prb, Probe; RPr, Right Probe. See also Figure S4.

