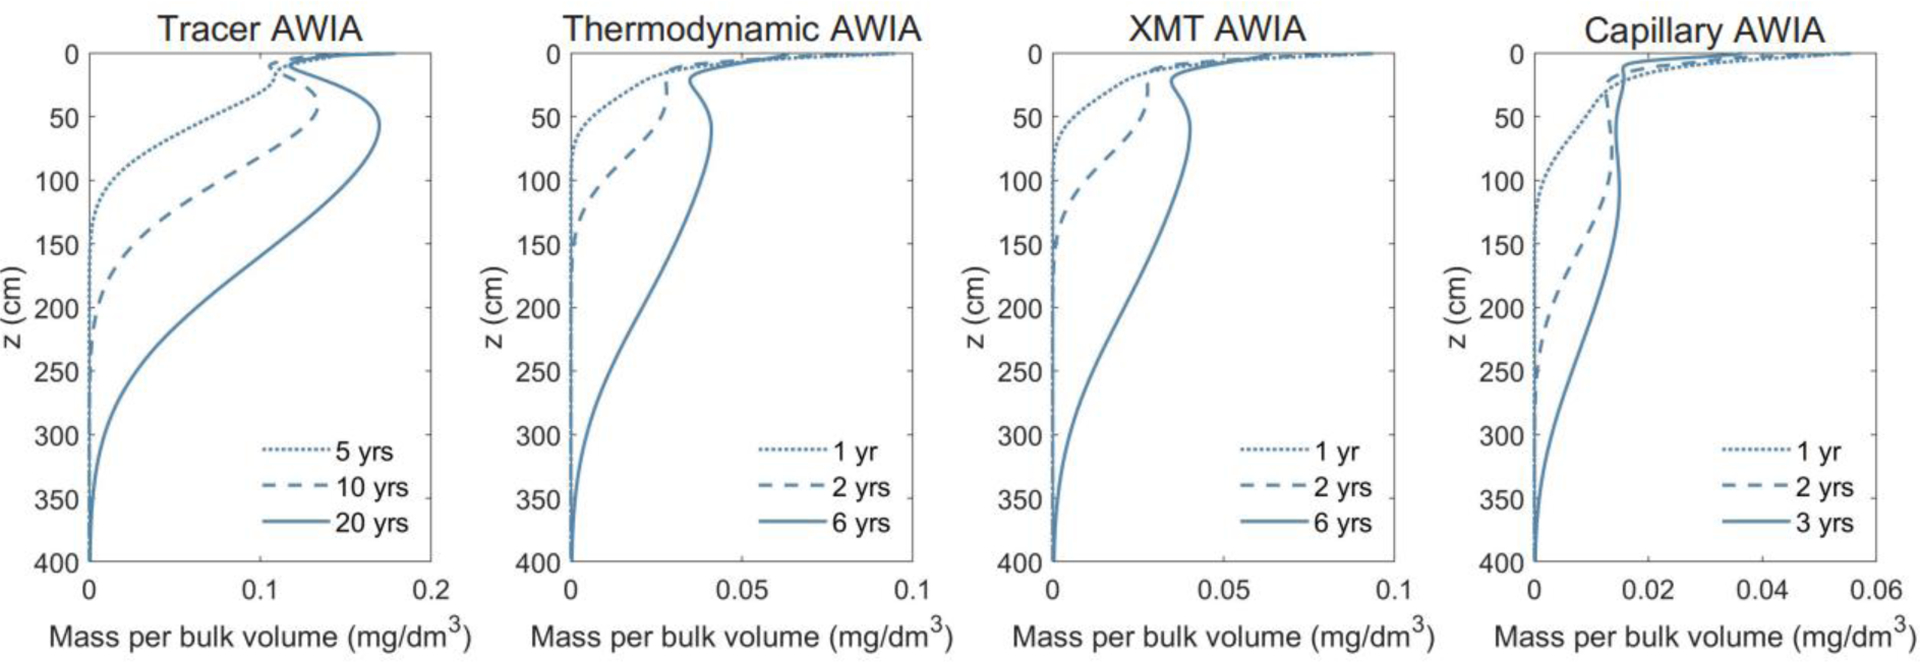
Figure 6.

Simulated long-term retention and leaching of PFOA at a model fire training area site employing different air-water interfacial areas (AWIA). “Tracer” represents the AWIA measured with the aqueous ITT methods; “XMT” represents the total AWIA measured with the XMT method; “Capillary” represents the capillary AWIA measured with the XMT method. The vertical axis is the depth from the land surface and the horizontal axis represents the mass of PFOA per bulk volume of soil media, i.e., it includes the mass in pore-water and at the solid-water and air-water interfaces. The simulations were produced with the model of Guo et al. (2020).
