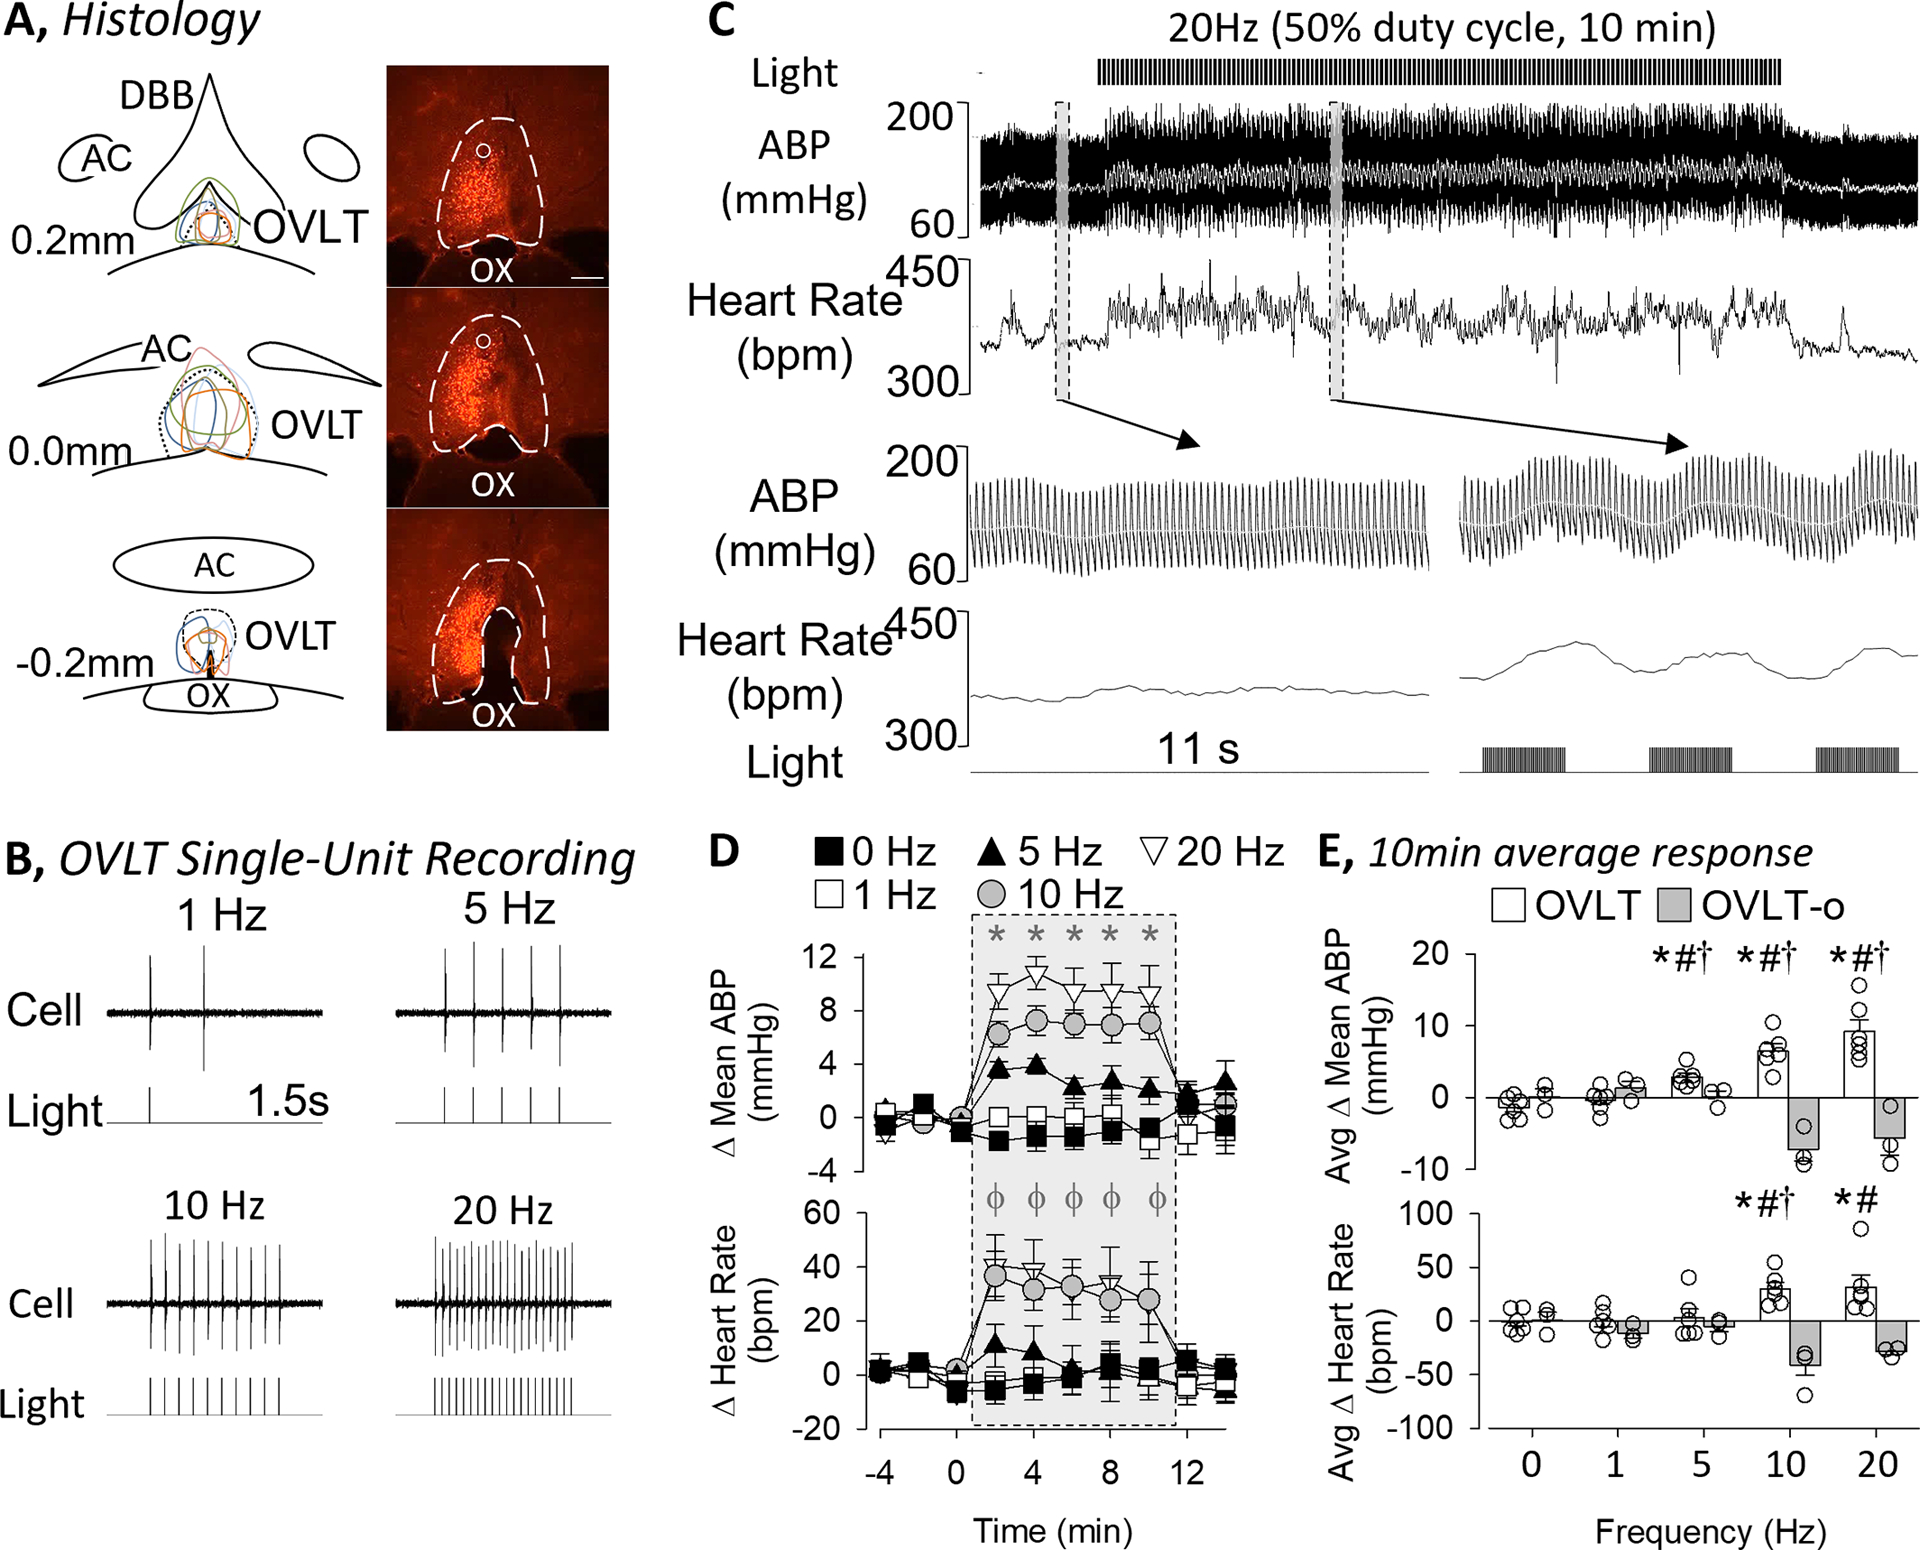
Figure 1.

A, Schematic illustration of mCherry expression for 6 OVLT rats and digital image of representative mCherry expression and optical ferrule. Scale bar = 200μm. B, In vivo single-unit recording of an OVLT neuron demonstrates optogenetic stimulation using 473nm light pulses (5ms pulse, 1s train) evokes 1:1 light:action potential response at various frequencies. C, ABP, mean ABP (grey line), and heart rate of an unanesthetized rat before, during, and after optogenetic stimulation of OVLT (20Hz, 5 ms pulse, 50% duty cycle). Grey bars highlight a 11s example of ABP and heart rate before and during stimulation. Note, the higher ABP and heart but also the oscillations present during the laser pulses. D, Mean±SEM of mean ABP and heart rate in response to optogenetic stimulation of OVLT (0, 1, 5, 10, 20 Hz; 5ms pulse, 10 min). *P<0.05 0Hz vs 5, 10, and 20Hz; ϕ P<0.05 0Hz vs 10 and 20 Hz. E, Mean±SEM of mean ABP and heart rate averaged during the 10 min stimulation period for animals with mCherry expression within the OVLT versus outside the OVLT or no expression (OVLT-o). Data were analyzed by a 2-way ANOVA with repeated measures followed by independent or paired t-tests with a layered bonferonni correction. *P<0.05 vs 0Hz, #P<0.05 OVLT vs OVLT-o, †P<0.05 vs lower frequency
