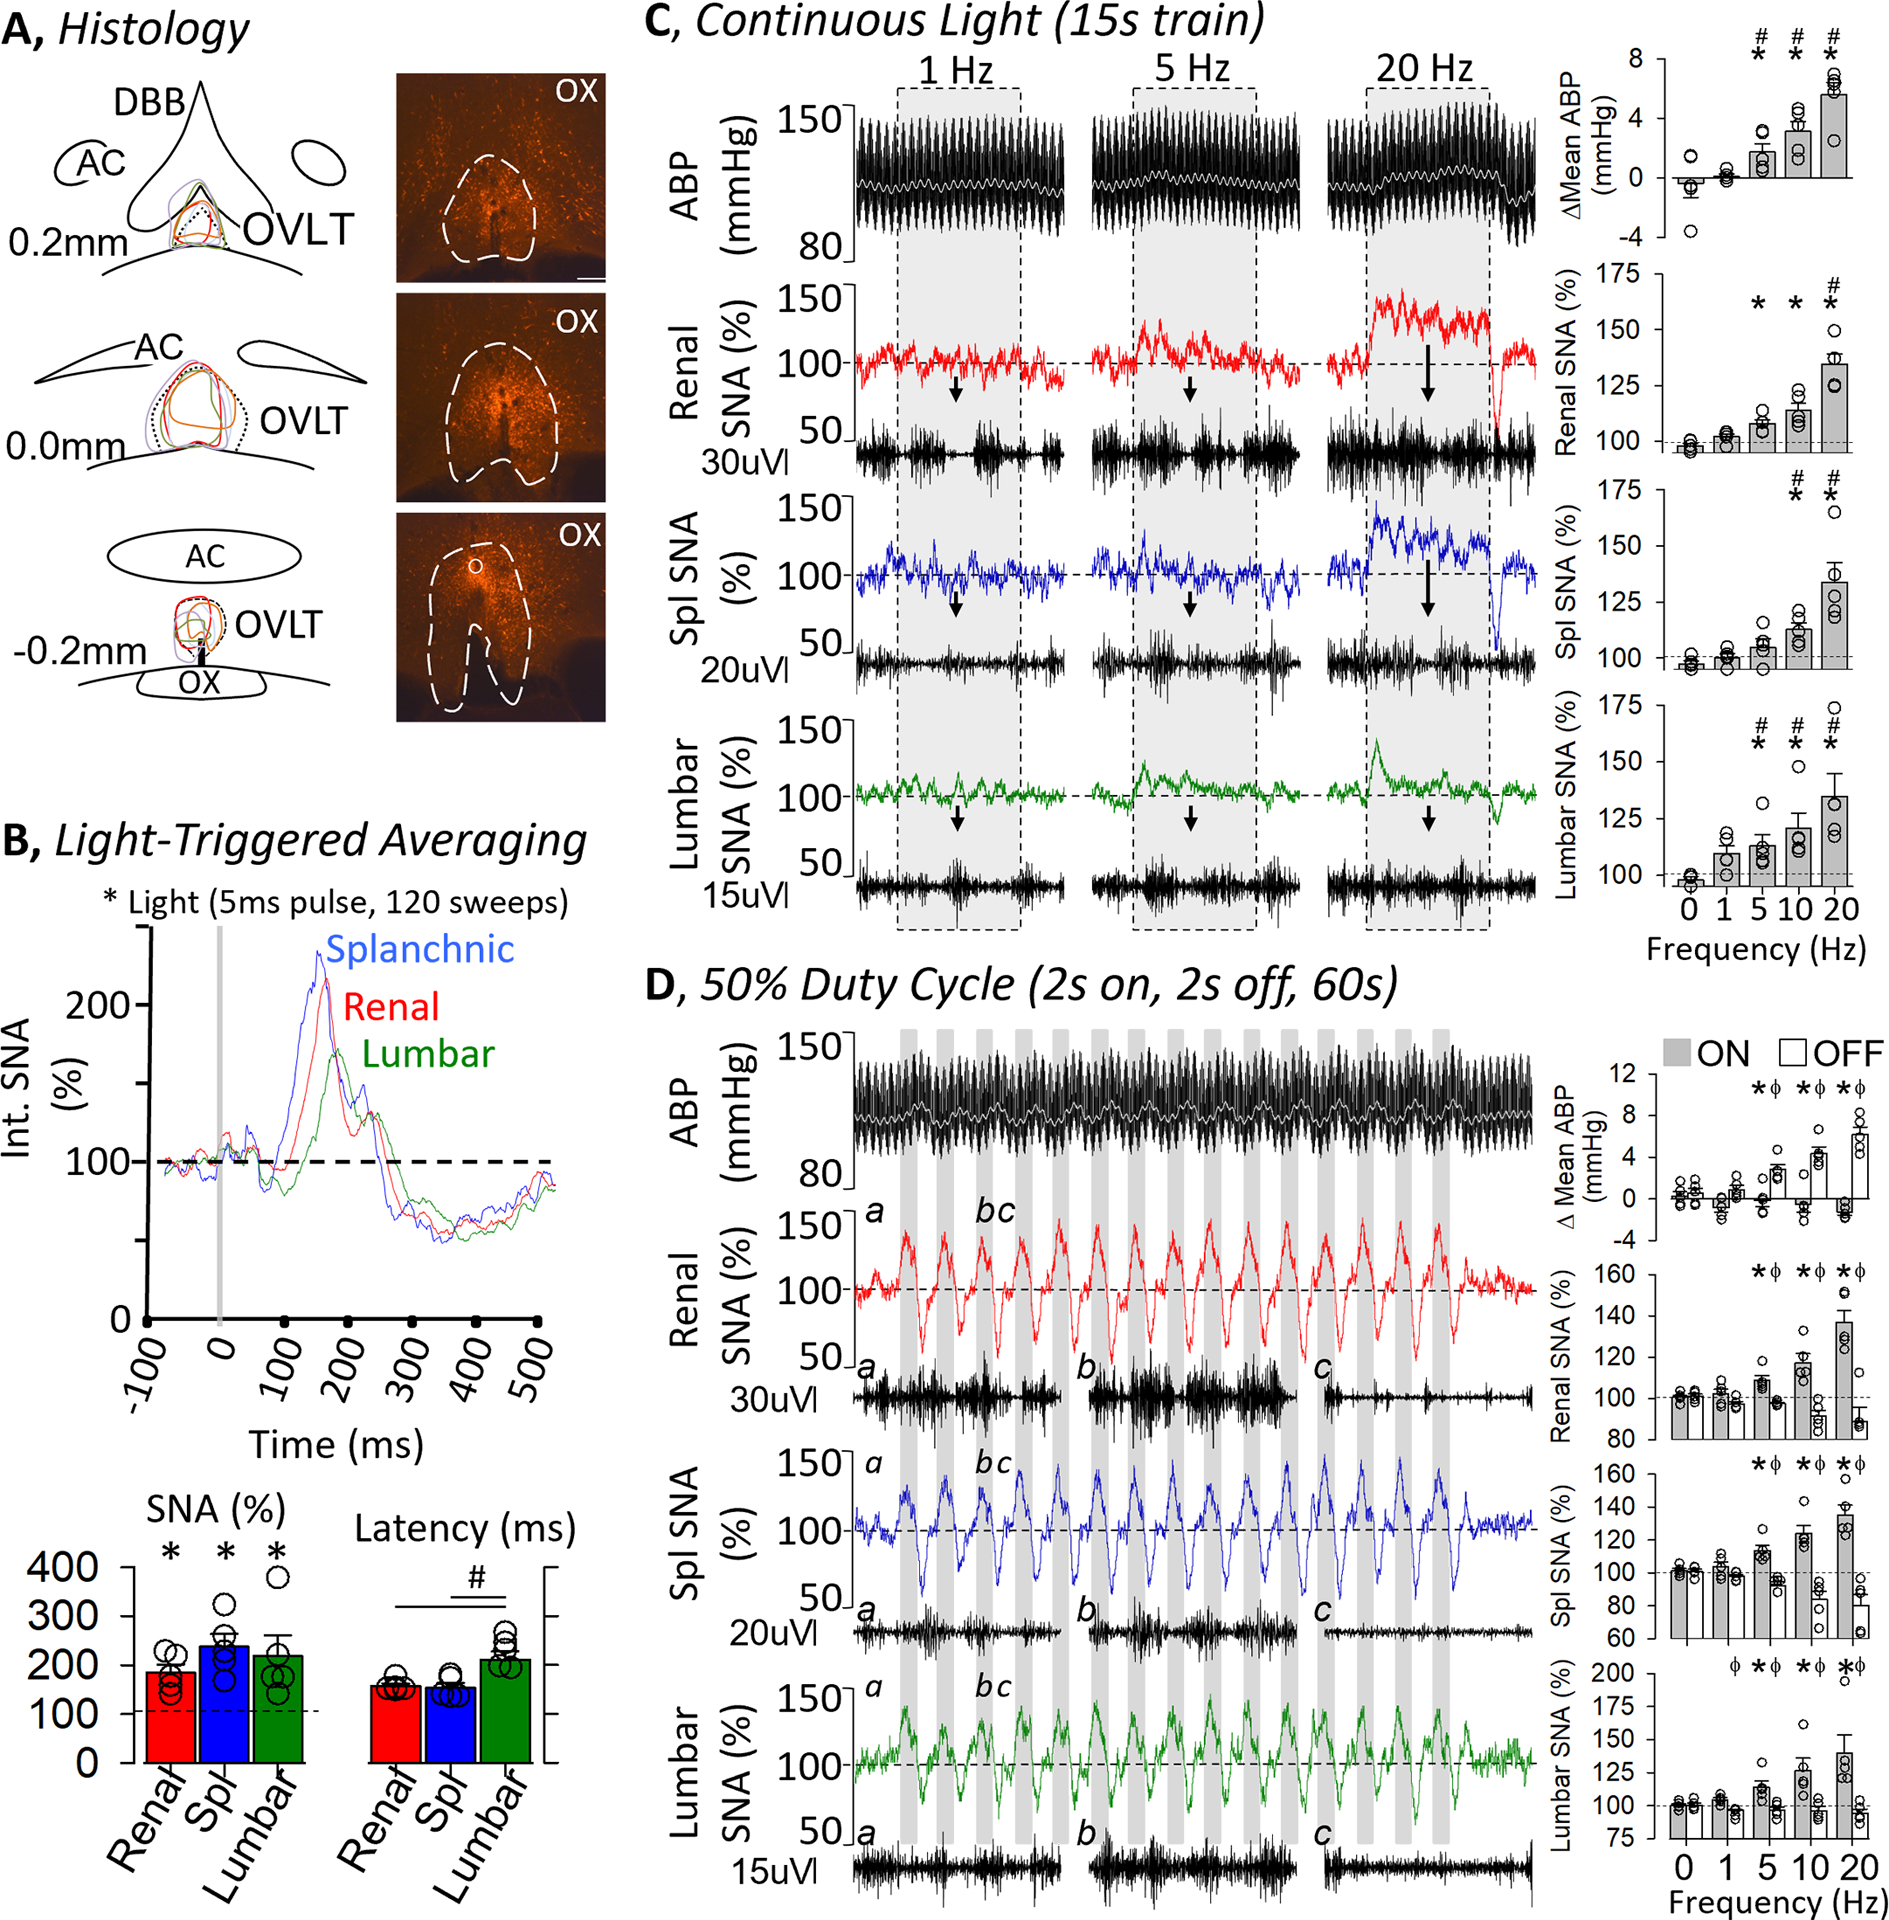
Figure 3.

A, Schematic illustration of mCherry expression for 5 OVLT rats and digital image of representative mCherry expression and optical ferrule. Scale bar = 200μm. B (TOP), Light-triggered averaging of splanchnic, renal and lumbar SNA during optogenetic stimulation of OVLT (1 Hz, 5ms pulse, 120 sweeps). (BOTTOM) 10-s peak change in SNA (% baseline) and latency to peak (ms). C and D, ABP and mean ABP (grey line) plus rectified/integrated renal, splanchnic, and lumbar SNA during optogenetic activation of OVLT neurons. Insets underneath each nerve illustrate 0.5s trace of raw nerve activity. (C) Continuous light pulses (15 s train, 5ms pulse; 1, 5 and 20Hz) were applied through the optical ferrule. (RIGHT) Summary data (mean±SEM and data points) illustrate the average change in ABP or SNA. (D) Intermittent light pulses (50% duty cycle, 60 s train, 5ms pulse) were applied. Note the oscillations in ABP and SNA. (RIGHT) Summary data (mean±SEM plus individual data points) illustrate the average peak change in ABP and SNA when the laser was “on” versus “off”. *P<0.05 vs 0 Hz, # P<0.05 vs lower frequency, ϕ P<0.05 light on vs off
