
Figure 5.
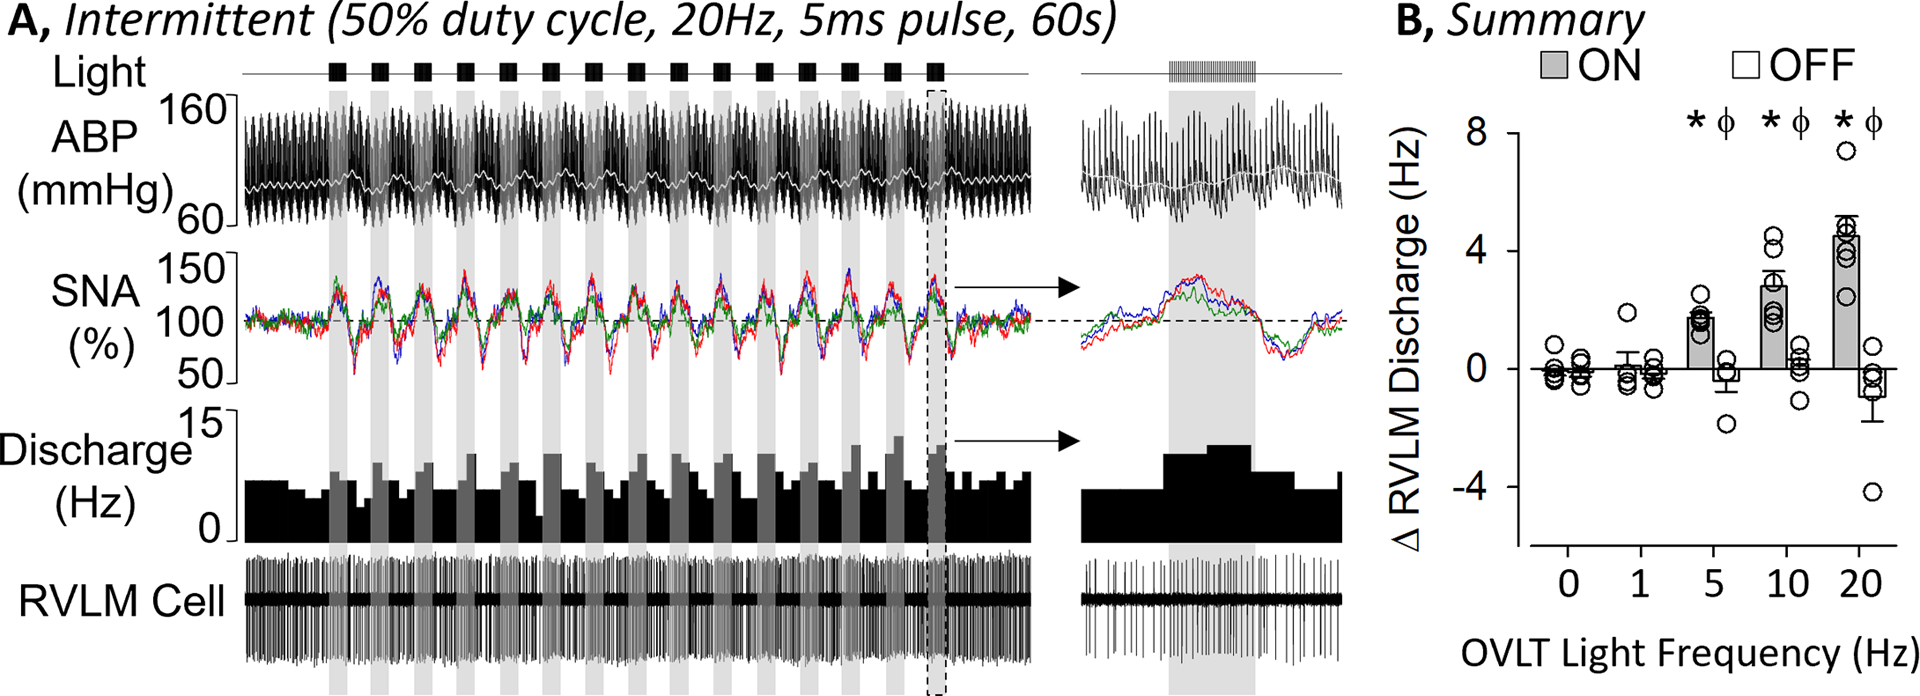
A, ABP, rectified/integrated SNA (renal – red, splanchnic - blue, lumbar - green), and RVLM single-unit discharge (rate histogram and raw cell activity) during optogenetic stimulation of OVLT neurons at 20 Hz using a 50% duty cycle light pulses (5ms pulse, 2s on / 2 s off, 60s train). B, Mean±SEM of the change in RVLM discharge during optogenetic activation of OVLT neurons at 0, 1, 5, 10, and 20 Hz in rats with OVLT mCherry expression when the laser was “on” versus “off”. *P<0.05 vs 0 Hz and lower frequency for light “on”, ϕ P<0.05 “on” versus “off”