
Figure 2. Effect of high glucose on syndecan-1.
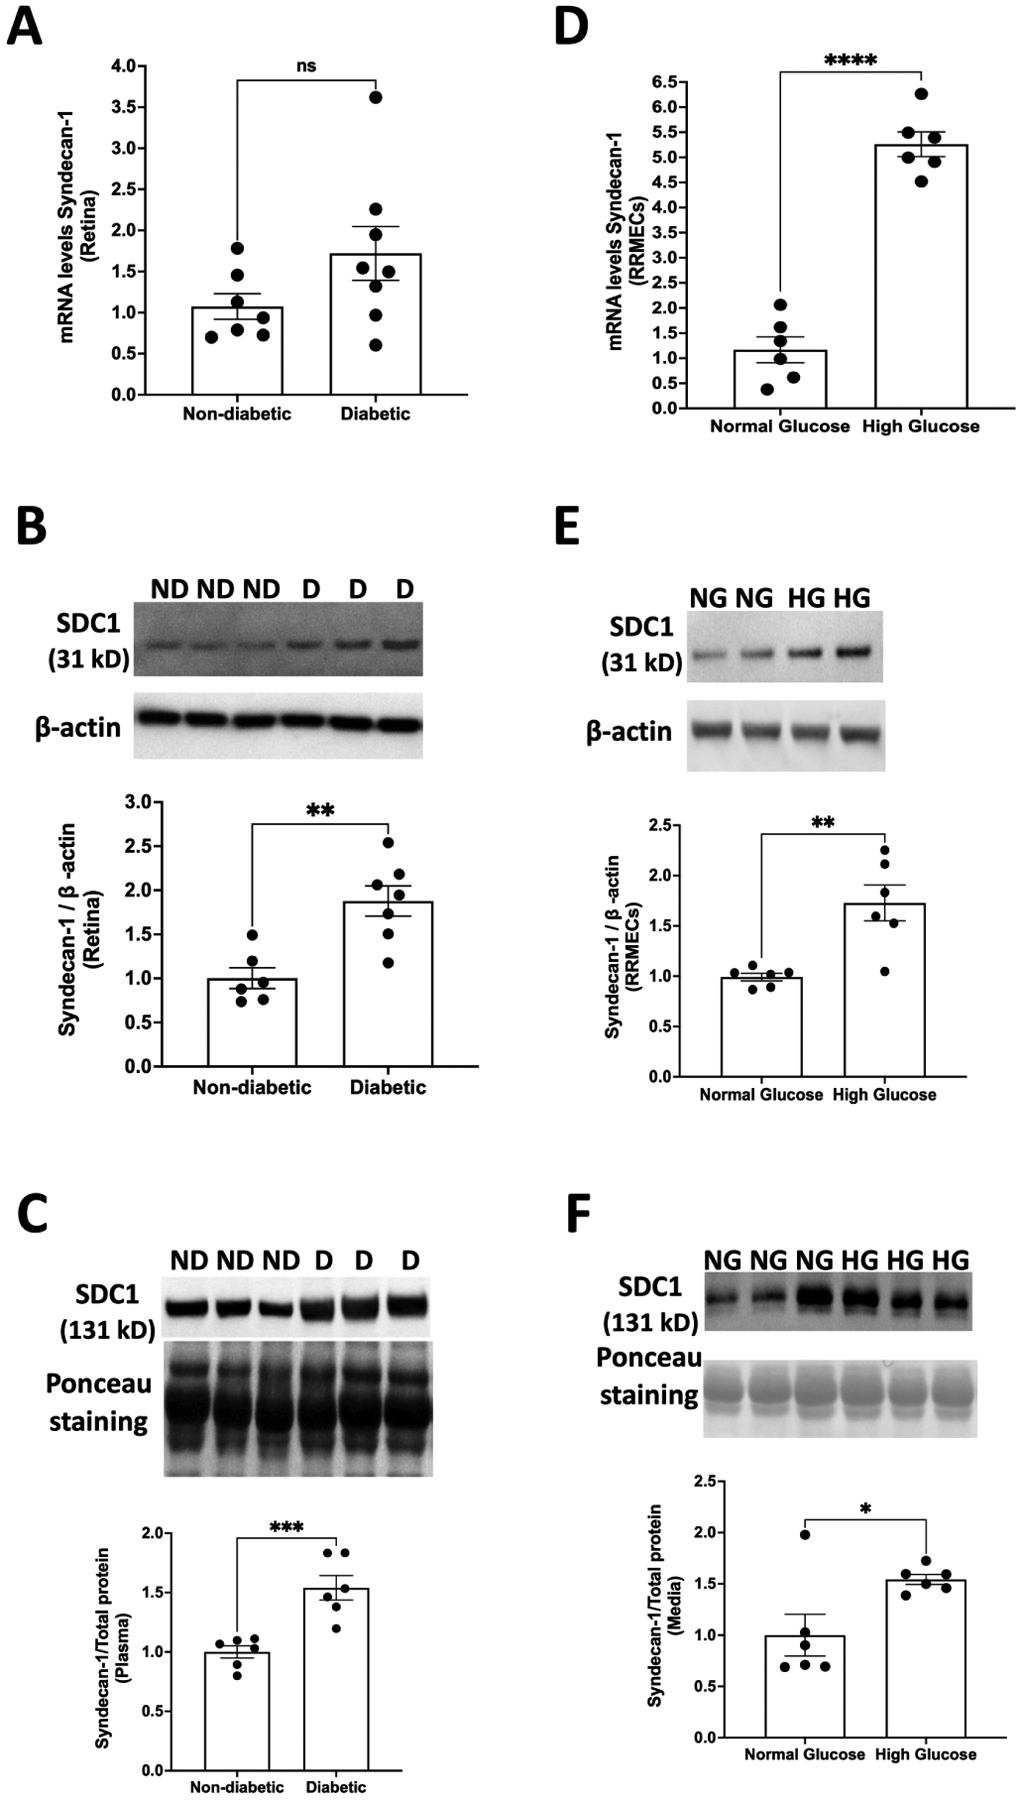
(A) mRNA levels of syndecan-1 tended to increase in the retinas of diabetic rats (p=0.11, n=7–8). In addition, diabetic rats exhibited a significant increase in (B) the protein expression of syndecan-1 in the retina (**p<0.01, n= 6–7) and (C) plasma levels of syndecan-1 (***p<0.001, n=6). RRMEC grown under high-glucose conditions showed a significant increase in both (D) mRNA (****p<0.0001, n=6) and (E) protein levels (**p<0.01, n=6) of syndecan-1. (F) Elevated levels of syndecan-1 in the media were seen following high-glucose treatment (*p<0.05, n=6) under hyperglycemic conditions. Western blot data normalized to either β-actin (RRMEC and retina) or total protein (plasma and media). ND, non-diabetic; D, diabetic; NG, normal glucose; HG, high glucose. ns = non-significant.