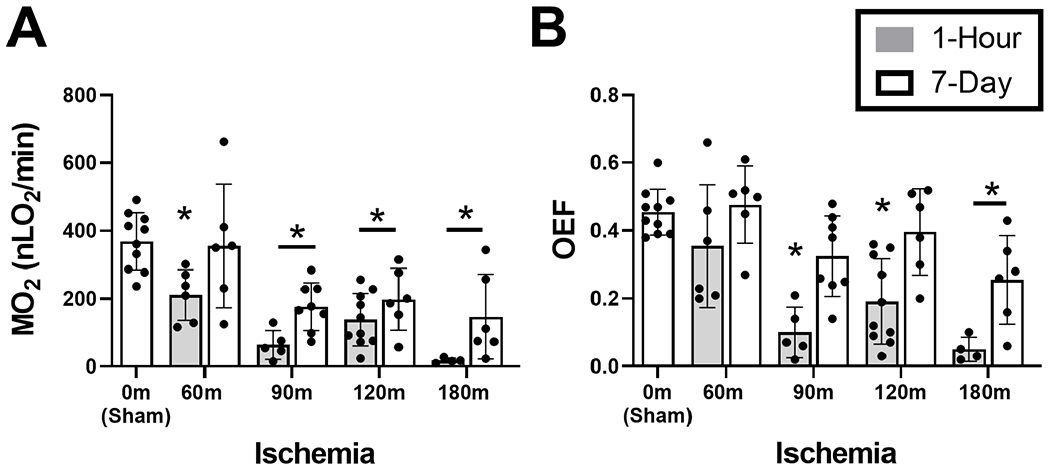
Figure 3. Retinal oxygen metabolism and extraction fraction following ophthalmic vessel occlusion.

Measurements of retinal oxygen metrics stratified by ischemia duration of 0 (sham), 60, 90, 120 and 180 minutes, and reperfusion durations of 1 hour or 7 days. (A) Oxygen metabolism (MO2) and (B) Oxygen extraction fraction (OEF). The data are presented as mean ± SD. Different of animals were evaluated in each group. * denotes significant difference compared to the sham group.
