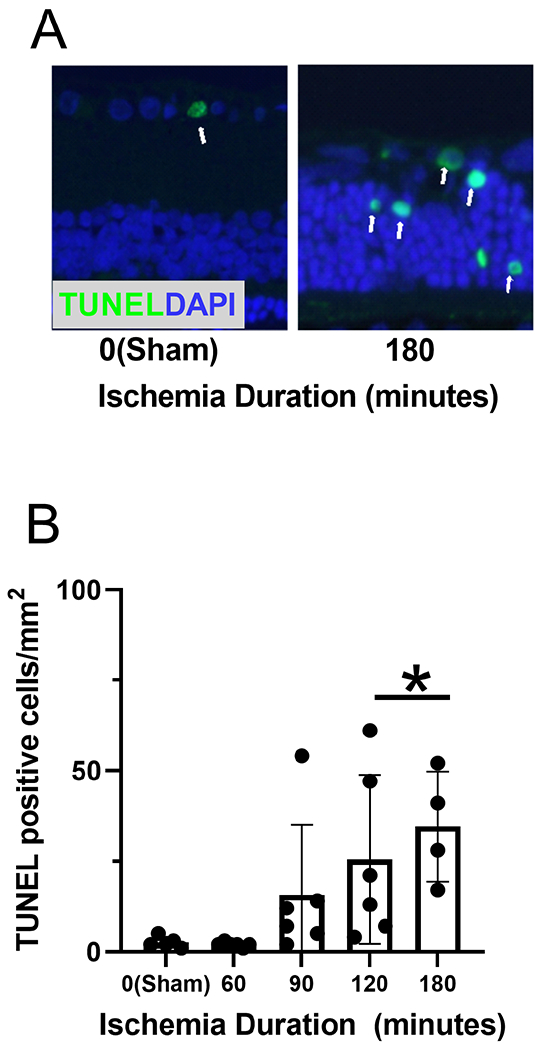
Figure 6. Retinal apoptotic cells following ophthalmic vessel occlusion.

(A) TUNEL staining, depicted as the green color, colocalized with cell nuclei, presented as blue color (DAPI) in representative retinal sections. The white arrows indicate co-expression in the same cell. (B) The number of TUNEL-positive cells measured after 7 days of reperfusion, stratified by duration of ischemia. The data are presented as mean ± SD. * denotes significant difference compared to the sham group.
