Summary
The biophysical properties of neurons are the foundation for computation in the brain. Neuronal size is a key determinant of single neuron input-output features and varies substantially across species1–3. However, it is unknown if different species adapt neuronal properties to conserve how single neurons process information4–7. Here, we characterize layer 5 cortical pyramidal neurons across 10 mammalian species to identify the allometric relationships that govern how neuronal biophysics change with cell size. In 9 of the 10 species, we observe conserved rules controlling voltage-gated potassium and HCN conductances. Species with larger neurons, and therefore decreased surface-to-volume ratio, exhibit higher membrane ionic conductances. This relationship produces a conserved conductance per unit brain volume. These size-dependent rules result in large but predictable changes in somatic and dendritic integrative properties. Surprisingly, human neurons do not follow these allometric relationships, exhibiting much lower voltage-gated potassium and HCN conductances. Together, our results in layer 5 neurons identify new conserved evolutionary principles for neuronal biophysics in mammals as well as unexpected features of the human cortex.
Input-output properties across species
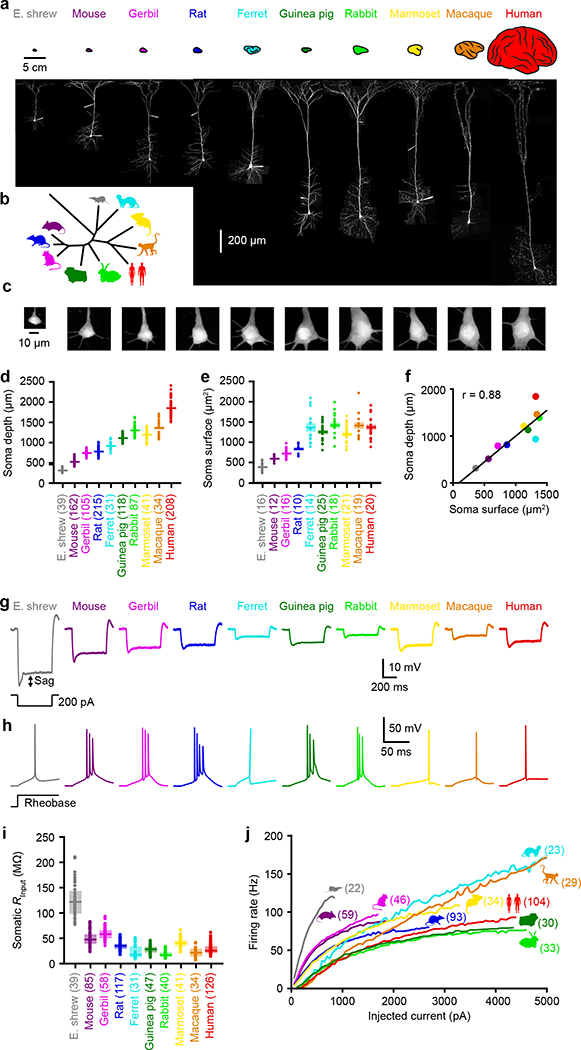
We systematically assessed the biophysical features of cortical neurons in acute brain slices from adult individuals. In addition to human brain samples obtained from neurosurgical patients at local hospitals4, we studied 9 mammalian species spanning a range of brain sizes and phylogenetic distances to humans (Figures 1a & 1b). We used patch-clamp electrophysiology to record from large layer 5 cortical pyramidal neurons (L5), a cell type that is reliably identifiable (see Methods) due to its morphology and electrophysiological features8. In all species, we targeted L5 neurons with the thickest dendrites to isolate putative extra-telencephalic neurons, also referred to as thick-tufted or L5B8,9 (see Methods). The depth of the L5 somas varied according to species (Figures 1d) and matched histologically-defined cortical layers (Extended Data Figure 1). The surface area and depth of L5 somas were correlated (r = 0.88; Figure 1e–1f), but not tightly matched. For instance, shorter neurons from ferrets and rabbits had somas of comparable sizes to human neurons (Figures 1d–1f). This likely reflects differences in neuronal densities (Extended Data Table 1) as primates are known to have higher neuronal densities than non-primates of similar sizes10.
Figure 1. Highly variable neuron size and input-output properties across species.
a, Two-photon Z-stack montage images of cortical L5 neurons in 10 mammalian species with corresponding cortex illustration above. See 1d for summary data and sample numbers.
b, Unrooted phylogenetic tree.
c, Representative two-photon images of somas of the different species. See 1e for summary data and sample numbers.
d-e, Anatomical measurements across species. Pooled data represent mean ± SEM. Sample numbers indicated in parentheses.
d, Somatic depth ((p ≈ 0 one-way ANOVA, F = 1798 & 9 df).
e, Somatic surface area (p < 10−34 one-way ANOVA, F = 40 & 9 df).
f, Relationship between so matic depth and surface area (R2 = 0.769, p < 0.001, linear regression, F = 26.6 & 8 df, n = 10).
g, Example somatic voltages in response to subthreshold step current injections.
h, Same as g but for threshold current injections to show spikes.
i, Somatic input resistance (p < 10−79 Kruskal-Wallis, χ2 = 399 & 9 df). Box plots denote the median and 25–75th percentiles. Sample numbers indicated in parentheses.
j, Firing rates as a function of injected current. Lines represent population medians. Sample numbers indicated in parentheses.
We began our study by evaluating the electrical properties of the soma, which is the point of convergence in the transformation of inputs to outputs. We first confirmed that neurons from all species match prototypical features of thick-tufted L5 pyramidal neurons8,9, such as prominent voltage sag and resonant impedance profiles (Extended Data Figure 2), to ensure that neurons of the same class were being compared. Next, we assessed the somatic input-output transformation, which relates injected current to action potential output (Figures 1g–1j). The somatic input resistance (RInput) varied considerably across species, such that an identical injection of current yielded dramatically different voltage deflections (Figures 1g & 1i). Firing patterns were also not conserved: high-frequency bursts were common only in select species (Figures 1h & Extended Data Figures 3 & 4). The heterogeneity we observed among species was surprising, given that the transformation from somatic current input to action potential output is thought to be a fundamental kernel of circuit computation.
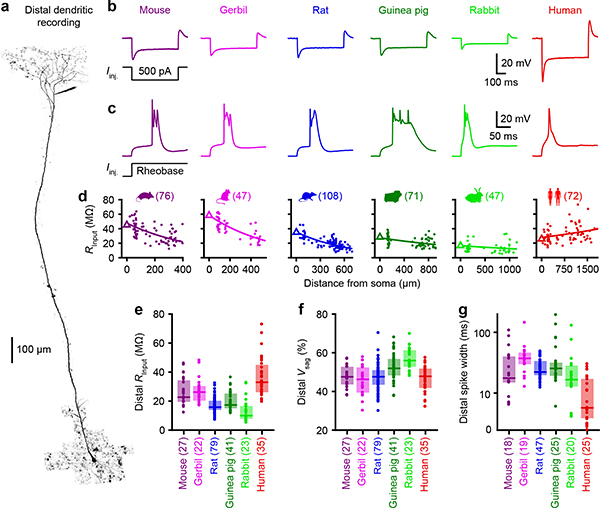
The vast majority of synaptic contacts are made at dendrites, which provide sophisticated active and passive forms of information processing at the front-end of the input-output transformation11. We therefore tested whether the variability we observed in somas (Figure 1) is a cell-wide phenomenon by performing dendritic whole-cell recordings (Figures 2a & 2b; due to limited tissue availability, dendritic recordings were restricted to human, mouse, gerbil, rat, guinea pig, and rabbit). Using local current injections, we mapped L5 dendritic properties at various distances from the soma (Figures 2d–2g and Extended Data Figures 5 & 6). Similar to the somatic recordings, current injections led to diverse responses across species, including variable input resistances and spiking behavior. With regard to suprathreshold properties, mice, gerbils, guinea pigs, and rabbits exhibited large complex dendritic spikes (Figure 2c) akin to the canonical calcium plateau potentials described in rats12,13. However, their detailed characteristics were not conserved across species (Figures 2g and Extended Data Figures 6 & 7). We observed a distinct suprathreshold behavior in human dendrites, characterized by small and narrow spikes4. Intriguingly, the high input resistances of human dendrites also diverged from other species (Figure 2e). Overall, this prominent variance in dendritic physiology strongly suggests that heterogeneous integrative properties manifest cell-wide.
Figure 2. Dendritic input-output properties are not conserved across species.
a, Two-photon Z-stack montage image of human neuron with a distal patch-clamp electrode 1617 μm from soma.
b, Distal dendritic voltage in response to subthreshold step current injections.
c, Same as b but for threshold current injections to show dendritic spikes.
d, Dendritic input resistance as a function of distance from the soma. Triangles are somatic medians and lines are exponential fit to the data. Sample numbers indicated in parentheses.
e-f, Subthreshold properties of distal dendrites. Box plots denote the median and 25–75th percentiles. Sample numbers indicated in parentheses.
e, Input resistance (p < 10−20 Kruskal-Wallis, χ2 = 105 & 5 df).
f, Voltage sag (p < 10−7 Kruskal-Wallis, χ2 = 42 & 5 df).
g, Spike width on a log scale of distal dendrites (p < 10−8 Kruskal-Wallis, χ2 = 46 & 5 df). Box plots denote the median and 25–75th percentiles.
Ionic conductances and neuron size
Our mapping of somatic and dendritic input-output properties across species revealed surprising variability. While morphological changes alone can substantially alter the electrical behavior of neurons14, ion channels also strongly shape subcellular operations. We set out to decipher whether changes in ion channel distributions contribute to the heterogeneous features of L5 cortical neurons. We focused our efforts on voltage-gated potassium channels (Kv) and HCN channels due to their experimental accessibility (large currents under little to no pharmacological isolation) as well as their strong influence on sub- and suprathreshold properties13,15,16.
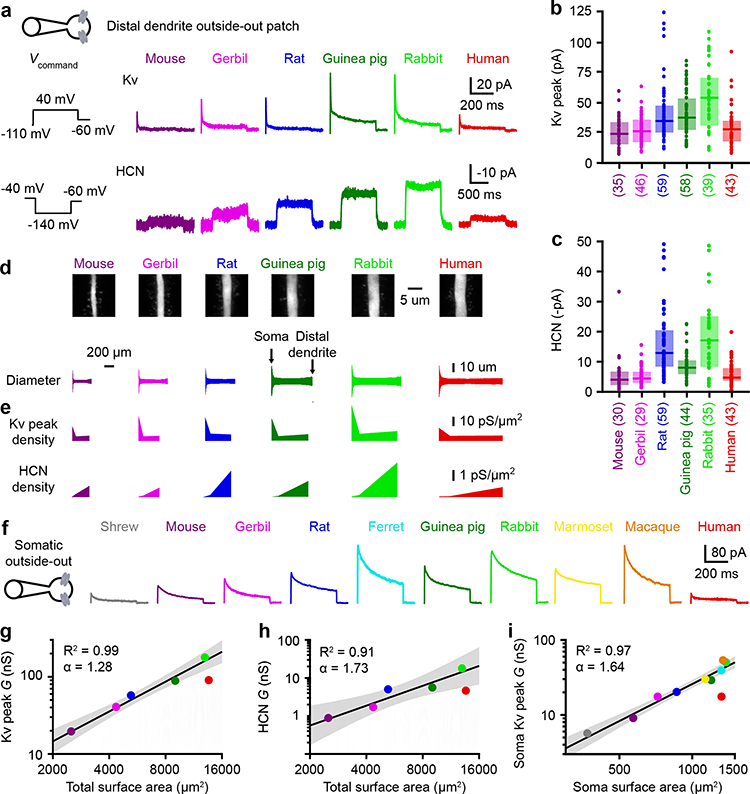
We performed outside-out recordings, in which we voltage-clamped small excised patches of membrane at somatic as well as distal and proximal dendritic locations (Figure 3a–3c & Extended Data Figure 8). Measured currents were converted into conductance densities (Figure 3e; also see Methods and Extended Data Figure 9). We then measured the diameter of L5 dendritic compartments using two-photon z-stacks of neurons shortly after removing the patch-clamp electrode, enabling estimation of surface area (Figure 3d). We used distance-dependent surface area estimates to integrate conductance density plots and compute total conductance estimates (Figure 3g & 3h). Our analyses revealed that local and total conductance generally increased from the smaller L5 neurons to the larger ones (Figures 3e, 3g, 3h & Extended Data Figure 8). However, human L5 neurons were outliers with low conductance despite their large size. To quantitatively determine how size relates to conductance, we used allometric relationships to relate parameters across orders of magnitude using logarithmic scales. When predicting the conductance of human L5 neurons based on the other species, we found human neurons to be statistically-significant outliers (Figures 3g, 3h & Extended Data Figure 8). These allometric analyses suggest human L5 neurons have an unexpected biophysical composition for their size.
Figure 3. Ionio conductance increases with size except in human neurons.
a, Dendritic outside-out patches were pulled from distal dendrites after obtaining whole-cell recordings.
b-c, Dendritic currents. Box plots denote the median and 25–75th percentiles. Sample numbers indicated in parentheses.
b, Kv peak currents (p < 10−8 Kruskal-Wallis, χ 2 = 45 & 5 df).
c, HCN currents (p < 10−16 Kruskal-Wallis, χ 2 = 84 & 5 df).
d, Top, two-photon Z-stack image of distal dendrites. Bottom, distance-dependent median diameter (mouse n = 12, gerbil n = 16, rat n = 10, guinea pig n = 15, rabbit n = 18, human n = 20).
e, Distance-dependent HCN and Kv peak conductance density.
f, Kv currents in somatic outside-out patches. Somatic HCN currents were negligible.
g-i, Allometric relationship on a log-log scale for conductance as a function of neuron size. The lines and shaded error bars represent the fit and 95% confidence interval of an allometric relationship constructed excluding humans.
g, Total (soma and dendrite) Kv peak conductance (p < 10−3, linear regression, F = 193 & 3 df, n = 5).
h, Total HCN conductance (p = 0.011, linear regression, F = 31.6 & 3 df, n = 5).
i, Somatic Kv peak conductance (p < 10−5, linear regression, F = 192 & 7 df, n = 9).
Our conductance measurements suggest human L5 neurons are outliers across 6 species. The tight correlation between the somatic and dendritic conductance (r = 0.944; Extended Data Figure 8l) for the 6 initial species suggests that conductance increases in a size-dependent fashion along the entire somatodendritic extent of the neurons. We thus extended our total conductance analysis to include four more species for which we could only obtain somatic data (Figure 3f). With 9 species excluding humans, we observed a faithful adherence to an allometric relationship between somatic Kv conductance and somatic surface area (Figure 3i). Surface area (R2 = 0.965, p < 10−5) was a better predictor than soma depth (R2 = 0.930, p < 10−4) for somatic Kv conductance, suggesting that the amount of membrane controls ionic conductance densities. Human L5 neurons were again the sole outliers, exhibiting a much lower Kv conductance than predicted (Figure 3f & 3i). Together, our ion channel measurements indicate that human L5 neurons have a unique biophysical makeup among the tested species.
To limit the potential confound of disease states associated with our human brain samples, we compared the biophysical properties of neurons from patients with hippocampal sclerosis; tumour; and other conditions, including gliosis and trauma. We found no significant differences in somatic outside-out currents between the three groups (Extended Data Figure 7). We also directly tested the effect of epileptic seizures on somatic ionic conductances in rats and found no significant differences (Extended Data Figure 7). Taken together, these results suggest that disease etiology is unlikely to underlie the distinct human features such as their low conductances.
Conserved conductance per brain volume
We next explored what other biophysical features can be explained by size by computing the amount of variance explained by allometric relationships with or without human neurons. Most variance in subthreshold properties was explained as long as human L5 neurons were left out. Size also explained most of the variance in somatic and dendritic excitability with or without humans. However, we found that size had very little explanatory power regarding detailed spike characteristics. High-frequency bursts were only frequent in glires (Extended Data Figure 4), which include rodents (mouse, gerbil, rat, and guinea pig) and lagomorphs (rabbits), suggesting that bursts may be specific to this clade. Furthermore, dendritic spikes had unpredictable shapes and sizes across species (Figure 2 and Extended Data Figures 6 & 7), but this could reflect complex interactions between dendritic length, ion channel densities, and somatic coupling4,12. Finally, maximal firing rates were not predictable, but the high somatic firing rates of some species (ferret and macaque) could be related to their surprisingly narrow action potentials (Extended Data Figure 3). Repeating this analysis by excluding other species (Extended Data Figure 10) did not yield substantial changes in explained variance, revealing only human L5 neurons are outliers among the species tested here.
Why do ionic conductances increase with neuronal size if they do not normalize integrative features? We theorized that the exponential increase in conductance (Figure 4d) could counteract some other changes associated with increasing neuronal size. One direct consequence of a brain with larger neurons is that fewer neurons can fit in the same volume. To explore the impact of neuronal densities on conductance distribution, we approximated a volume composed of L5 somas of different species (Figure 4c). We also considered a volume filled with scaled-up mammal L5 somas, which are the same size as human neurons but follow the allometric rules that apply to all other species (Figure 4c). We computed the Kv conductance density per brain volume (Figures 4c & 4f) and discovered it was constant in all tested species besides humans (Figure 4f). To understand why, we assessed more closely the geometry of neuronal compartments. We found that larger neurons have lower surface-to-volume ratios, meaning that the total membrane area for a specific brain volume is lower (Figure 4e). Overall, the increase in membrane conductance with size (Figure 4d) effectively cancels out the decrease in surface-to-volume ratio (Figure 4e) to maintain a constant conductance per unit volume (Figure 4f). To test this idea further, we next computed the conductance density in the cortex using neuronal density measurements from the literature (Extended Data Table 1) to account for neuropil (Figure 4g). Lower neuronal densities were associated with larger L5 soma volumes (Extended Data Figure 8m), allowing us to use the simplifying assumption that all neurons are L5 neurons. Again, cortical Kv conductance was constant across species (Figure 4h), leading to a linear increase in cortical conductance with size (Figure 4i). Humans, however, were outliers at every stage (Figures 4c–4j). With lower ionic conductance than predicted for their size, humans had lower ion channel conductance per volume than all the other species, leading to a total cortex conductance four times lower than predicted (Figures 4i & 4j and Extended Data Figure 8). Overall, our analyses suggest that in all tested species except humans, size-dependent rules for membrane conductances lead to conserved conductance per volume but not to conserved input-output properties.
Figure 4. Humans are an exception to the allometric relationship that normalizes ionic conductance per brain volume.
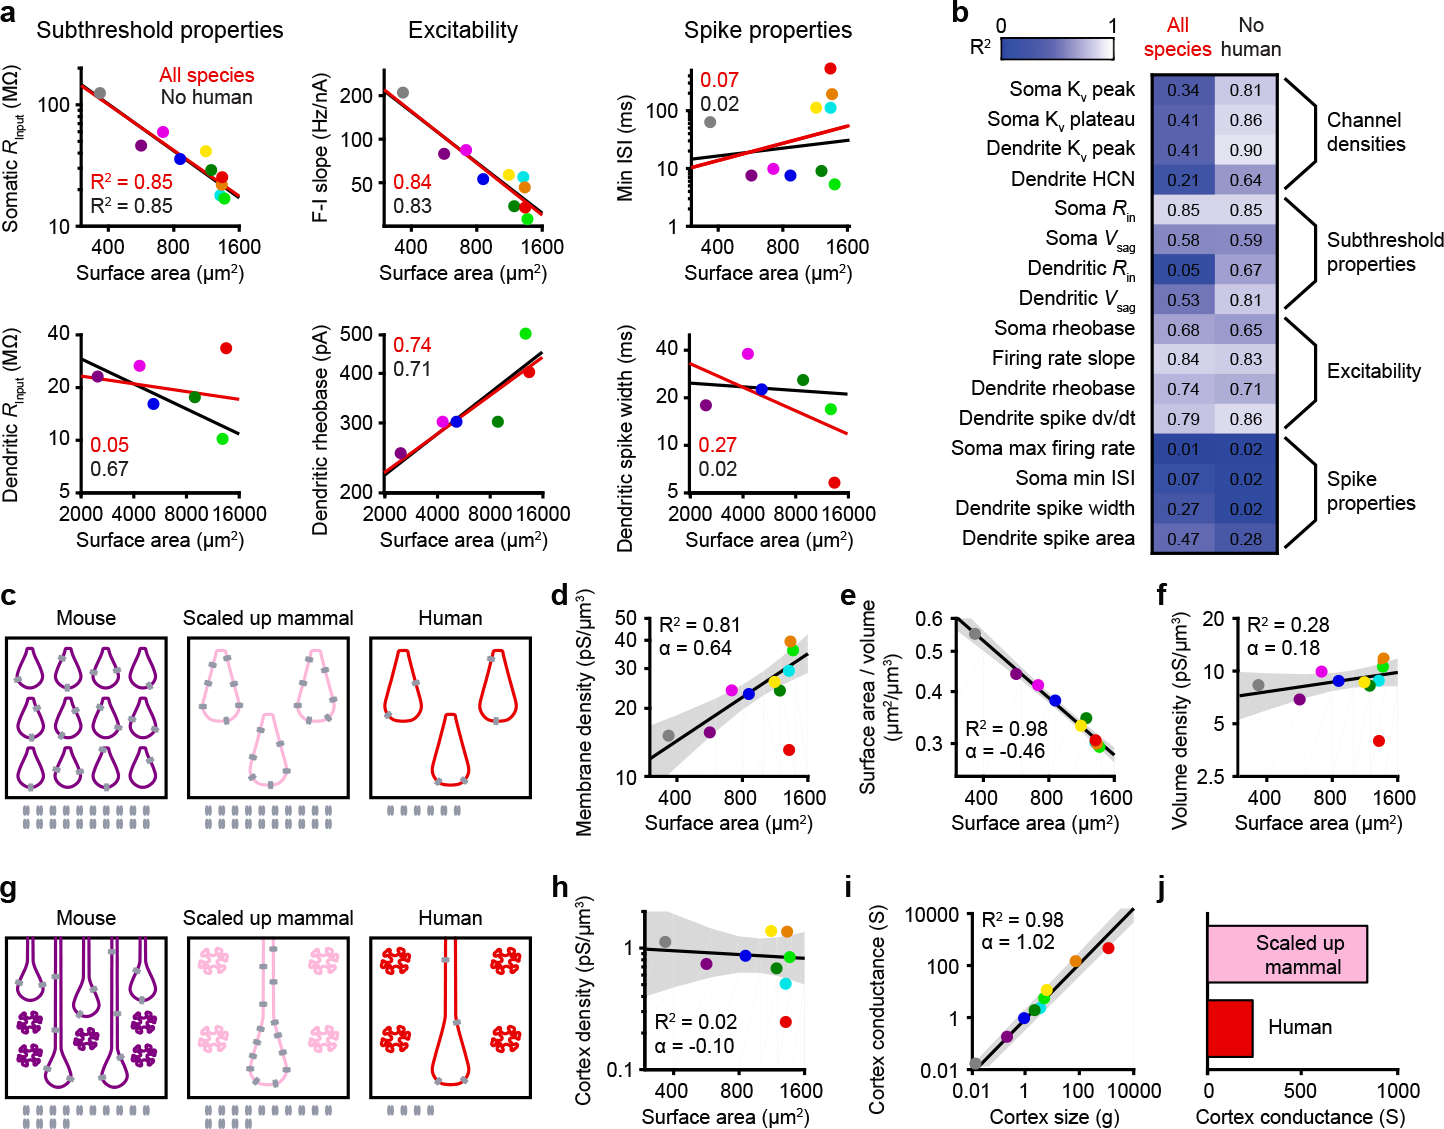
a, Allometric relationships.
b, Explained variance.
c, Schematic representation of brain volume occupied by L5 somas. Number of ion channels indicated at bottom.
d-f, Allometric relationship on a log-log scale for somatic Kv peak conductance densities in volumes as in c. The lines and shaded error bars represent the fit and 95% confidence interval of the relationship constructed excluding humans.
d, Membrane conductance density (p = 0.001, linear regression, F = 29.2 & 7 df, n = 9).
e, Surface-to-volume ratio (p < 10−6, linear regression, F = 318 & 7 df, n = 9).
f, Volume Kv peak conductance density where the volume is filled with somas (p = 0.14, linear regression, F = 2.8 & 7 df, n = 9).
g, Schematic representation of cortex volume with neuronal density from Extended Data Table 1.
h-I, Allometric relationship on a log-log scale for somatic Kv peak conductance densities in volumes as in g. The lines and shaded error bars represent the fit and 95% confidence interval of a relationship constructed excluding humans. Gerbils were not included because the necessary information was not available in the literature.
h, Cortex conductance density with accurate neuronal densities (p = 0.74, linear regression, F = 0.12 & 6 df, n = 8).
i, Total cortex conductance (p < 10−5, linear regression, F = 356 & 6 df, n = 8)
j, Estimated human brain conductance and expected conductance for scaled up mammalian brain.
Discussion
We generated a unique dataset composed of more than 2250 patch-clamp recordings (Extended Data Table 2) from a single type of cortical pyramidal neuron across 10 mammalian species that allowed us to reach two new conclusions. First, the biophysical building plan for L5 neurons of different sizes across species does not conserve functional input-output properties but instead normalizes conductance per unit brain volume. Second, human L5 neurons exhibit a distinct biophysical composition compared to other tested species.
The other 9 species tested here did not exhibit outlier status according to our analyses in Extended Data Figure 10. Nevertheless, there were intriguing features associated with other species worthy of future investigation, such as the fast action potentials in macaque and ferret neurons. Their origin is unclear but our results (Extended Data Figure 3) are consistent with a prior study that observed very fast action potentials in macaque L5 neurons via extracellular recording17. To ensure that the variability in action potential waveforms was not due to differences in brain regions, we compared the firing properties of rat TEA versus M1 and observed only minor changes compared to the large cross-species differences (Extended Data Figure 3). Future work is needed to determine what underlies features like narrow action potentials, as well as other properties across species that were not predictable by size.
While human cortex adheres to allometric rules regarding its cellular composition and size10, we find that this is not the case at the biophysical level, unlike all the other mammals we tested. We demonstrate here that the biophysical properties of human L5 neurons are not expected for their size, providing a novel and important locus for future investigations into the human condition. Further work is needed to determine the evolutionary pressures underlying these distinctive features and their contribution(s) to human brain function.
Methods
Human and animal models
Species selection
In addition to humans, 9 mammalian species were included. Non-mammals were not considered due to a lack of a 6-layer cortex and homologous cell types. Mice and rats were included because they are the standard animal models in electrophysiological studies. Marmosets and macaques were included because they are non-human primates and tissue samples were available through local collaborations. Etruscan shrews were included because of their very small brains and neurons. Ferrets were added because they have large neurons but are phylogenetically distant from rodents and primates. Gerbils, guinea pigs, and rabbits were selected because they are available through scientific vendors and their neuron size complemented the other species. Due to varying brain organization and technical consideration, the precise brain regions varied across species but were selected to be the closest analogues to human anterior temporal lobe (see details for individual species below). All animals were used in accordance with NIH where applicable and the Massachusetts Institute of Technology Committee on Animal Care guidelines. No sample size calculation was performed. Sample sizes are comparable or larger than similar studies4,5,6. No blinding or randomization was possible with the study design.
Etruscan shrew
Etruscan shrew (suncus etruscus) were gifted from Michael Brecht at Humboldt University. Males were housed in groups (up to three) and used for experimentation at 3–9 months of age.
Mouse
C57BL/6 mice (mus musculus) were purchased from Charles River. Male mice were housed in groups (up to four) or singly and used for experimentation at 12–28 weeks of age. Mice were house on a 12/12 dark/light cycle in a room at 20–22 °C and 40–45 % humidity.
Gerbil
Mongolian gerbils (meriones unguiculatus) were purchased from Charles River. Male gerbils were housed in pairs or singly and used for experimentation at 13–17 weeks of age.
Rat
Sprague Dawley rats (rattus norvegius) were purchased from Charles River. Male and female rats were housed in pairs or singly and used for experimentation at 12–32 weeks of age.
Ferret
Two ferrets (mustela putorius furo) were obtained from Christopher Walsh’s laboratory at Harvard Medical School and underwent in utero electroporation surgery for an unrelated experiment prior to being used for our experiments. Six more ferrets were gifted by Tufts University where the only experimental manipulation they would have had is the administration of commercially available human influenza vaccine. Female ferrets were used for experimentation at 9–16 months of age.
Guinea pig
Hartley guinea pigs (cavia porcellus) were purchased from Charles River. Male retired breeders were housed alone and used for experimentation at 27–32 weeks of age.
Rabbit
New Zealand White rabbits (oryctolagus cuniculus) were purchased from Charles River. Male and female rabbits were housed alone and used for experimentation at 25–52 weeks of age.
Marmoset
Brain samples were obtained from two males (5 and 7 years old) and two female (2 and 6 years old) common marmosets (callithrix jacchus) at MIT that were euthanized as part of experiments unrelated to current study.
Macaque
Brain samples were obtained from 6 male rhesus macaques (macaca mulatta) at MIT or Harvard Medical School that were euthanized as part of experiments unrelated to current study (8.5, 9.5, 12, 19, and 21 years old).
Human
Human (homo sapiens) tissue was acquired through collaboration with the Massachusetts General Hospital (MGH) and the Brigham and Women’s Hospital (BWH). For MGH, tissue was obtained as “discarded tissue” from neurosurgical patients in accordance with protocols approved by the Massachusetts General Hospital Internal Review Board (IRB). Patients consent to surgery and a subset of the resected tissue was considered discarded tissue. Under our IRB-approved protocol, such discarded tissue was available for this specific research project for use without explicit patient consent. For BWH, the protocol was approved by the institutional review board, and patients provided consent prior to the surgery. At both institutions non-essential samples were extracted by the supervising neuropathologist per protocol.
Patients were male or female adults aged 20–64 years. We report only the sex of the patients because information on their gender identity was not available. Additional patient information is included in Extended Data Table 3. Samples were not allocated to distinct experimental groups and information about the patient was not available until after data acquisition and analysis.
Brain slice preparation
Slicing
Slicing artificial cerebrospinal fluid (aCSF) contained (in mM): sucrose 160, sodium bicarbonate 28, potassium chloride 2.5, sodium phosphate monobasic monohydrate 1.25, calcium chloride 1, magnesium chloride 7.5, glucose 7.25, hepes 20, sodium pyruvate 3, and sodium ascorbate 3, 295–305 mOsm, pH adjusted to 7.4 with sodium hydroxide. Recovery aCSF contained (in mM): sodium chloride 92, sodium bicarbonate 28.5, potassium chloride 2.5, sodium phosphate monobasic monohydrate 1.2, calcium chloride 2, magnesium chloride 4, glucose 25, hepes 20, sodium pyruvate 3, and sodium ascorbate 5, 300–310 mOsm, pH adjusted to 7.4 with sodium hydroxide. All solutions were saturated with 95% O2 and 5% CO2. Slicing was performed with a vibrating blade microtome in ice-cold slicing aCSF. 300 μm slices were incubated for ~30 minutes at 35.5 °C in recovery aCSF. Slices were then stored at ~20 °C until use. Incubation solutions were replaced every 4–8 hours.
Etruscan shrew slice preparation
Etruscan shrews were deeply anesthetized with isoflurane. After decapitation, the head was submerged in ice-cold slicing aCSF. The brain was extracted in ~1 minute and placed in slicing aCSF. The two brain hemispheres were either cut apart or kept together. To obtain coronal slices, samples were glued on their frontal surface after performing a blocking cut. Recordings were restricted to the temporal medial cortex18.
Mouse slice preparation
Mice were deeply anesthetized with isoflurane. After decapitation, the head was submerged in ice-cold slicing aCSF. The brain was extracted in less than 30 seconds and placed in slicing aCSF. To obtain slices perpendicular to the surface of the brain, we performed a blocking cut in the frontal cortex of both hemispheres with a ~30° yaw angle off the coronal axis. The two hemispheres were separated and glued on their frontal surface. Recordings were restricted to the temporal association cortex (TEA)2 using the Allen Mouse Brain Atlas as reference (https://mouse.brain-map.org/static/atlas).
Gerbil slice preparation
Gerbils were deeply anesthetized with isoflurane. After decapitation, the head was submerged in ice-cold slicing aCSF. The brain was extracted in less than 30 seconds and placed in slicing aCSF. To obtain slices perpendicular to the surface of the brain, we performed a blocking cut in the frontal cortex of both hemispheres with a ~35° yaw angle off the coronal axis. The two hemispheres were separated and glued on their frontal surface. Recordings were restricted to TEA using the same landmarks as for mouse and rat brains.
Some brain extractions were performed in the animal facility. Slicing aCSF was oxygenated for >15 minutes in lab, transported in sealed conditions and used within 15 min. After brain extraction, the brain was transported in sealed conditions for ~5 minutes before transferring it to freshly oxygenated solution.
Rat slice preparation
Rats were deeply anesthetized with isoflurane. After decapitation, the head was submerged in ice-cold slicing aCSF. The brain was extracted in less than 30 seconds and placed in slicing aCSF. To obtain slices perpendicular to the surface of the brain, we performed a blocking cut in the frontal cortex of both hemispheres with a ~35° yaw angle off the coronal axis. The two hemispheres were separated and glued on their frontal surface. The pia was completely removed from the cortical surface with fine forceps. Slice preparation with epileptic rats was similar but the extracted brain was transported from MGH to MIT prior to slicing the same way human tissue was transported. Recordings were restricted to TEA2 using the Rat Brain Atlas as reference19 for all recordings except Extended Data Figures 3k–m.
Ferret slice preparation
For ferrets euthanized at MIT, anesthesia was induced with ketamine (25 mg/kg) and xylazine (2 mg/kg) intramuscular and supplemented with 5% isoflurane. Following a thoracotomy, ferrets were perfused with slicing aCSF for 1–3 min. Slicing aCSF was oxygenated for >15 minutes in lab, transported in sealed conditions and used within 20 min. After decapitation, the head was submerged in ice-cold slicing aCSF. The brain was extracted in 2–5 minutes and placed in slicing aCSF. The brain was then transported in sealed conditions for 5–10 minutes before transferring it to freshly oxygenated solution.
For ferrets euthanized at Harvard Medical School, animals were euthanized with Fatal plus. Following a thoracotomy, ferrets were perfused with slicing aCSF for 1–3 min. Slicing aCSF was oxygenated for >15 minutes in lab, transported in sealed conditions and used within 20 min. After decapitation with scissors, the brain was extracted in 5–10 minutes and placed in slicing aCSF. The brain was then transported in sealed conditions for 15–25 minutes before transferring it to freshly oxygenated solution.
Pia and surface blood vessels that would obstruct slicing were removed with forceps. The posterior half of the suprasylvian gyrus20 was separated from surrounding brain regions and cut in small pieces (~3 mm × 3 mm) perpendicular (<10 degrees off) to the surface of the brain.
Guinea pig slice preparation
Guinea pigs were deeply anesthetized with isoflurane. After decapitation, the head was submerged in ice-cold slicing aCSF. The brain was extracted in 1–2 minutes and placed in slicing aCSF. The brain was then transported in sealed conditions for ~5 minutes before transferring it to freshly oxygenated solution. The pia was completely removed from the cortical surface with fine forceps. The temporal cortex was isolated and cut in small pieces (~3 mm × 3 mm) perpendicular (<10 degrees off) to the surface of the brain.
Rabbit slice preparation
Anesthesia was induced with ketamine (35 mg/kg) and xylazine (5 mg/kg) intramuscular and supplemented with 5% isoflurane. Following a thoracotomy, rabbits were perfused with slicing aCSF for 1–3 min. Slicing aCSF was oxygenated for >15 minutes in lab, transported in sealed conditions and used within 20 min. After decapitation, the head was submerged in ice-cold slicing aCSF. The brain was extracted in 1–2 minutes and placed in slicing aCSF. The brain was then transported in sealed conditions for ~10 minutes before transferring it to freshly oxygenated solution. The pia was completely removed from the cortical surface with fine forceps. The temporal cortex based on this atlas21 was isolated and cut in small pieces (~3 mm × 3 mm) perpendicular (<10 degrees off) to the surface of the brain
Marmoset slice preparation
Marmosets were perfused with slicing aCSF for 5–20 min. Slicing aCSF was oxygenated for >15 minutes in lab, transported in sealed conditions and used within 20 min. The brain was extracted in ~5 minutes and placed in slicing aCSF. The brain was then transported in sealed conditions for 10–15 minutes before transferring it to freshly oxygenated solution. A piece of cortex containing inferotemporal gyrus (ITG), superior temporal gyrus (STG) and temporal cortex (TE) was excised based on this atlas22. Pia and surface blood vessels that would obstruct slicing were removed with forceps. The sample was then cut in small pieces (~3 mm × 3 mm) perpendicular (<10 degrees off) to the surface of the brain.
Macaque slice preparation
For two macaques, unilateral or bilateral craniotomies were performed under anesthesia over the temporal lobe. The dura was surgically removed before excising small portions of the temporal lobe. For another macaque, the whole brain was extracted following euthanasia. Tissue was placed in slicing ACSF. For all cases, resected tissue included the temporal cortex between the lateral fissure and the anterior middle temporal sulcus from the tip of the anterior temporal lobe to Bregma −14 mm based on this atlas23.
Slicing aCSF was oxygenated for >15 minutes in lab, transported in sealed conditions and used within 20 min. The brain was then transported in sealed conditions for ~5 minutes before transferring it to freshly oxygenated solution. Pia and surface blood vessels that would obstruct slicing were removed with forceps. The sample was then cut in small pieces (~3 mm × 3 mm) perpendicular (<10 degrees off) to the surface of the brain.
Human slice preparation
Resected human tissue was considered discarded tissue after being examined by neuropathologists whose main objective was to ensure there was adequate tissue for diagnostic purposes. The neocortical tissue was obtained from the lateral anterior temporal lobe (middle and inferior temporal gyri) in patients undergoing resection of the temporal lobe including mesial structures for medically-intractable epilepsy. The neocortical tissue displayed no known abnormalities at the level of MRI scans, gross inspection, and subsequent microscopic examination as part of the standard neuropathologic assessment of the tissue. Patients undergoing resective surgery were primarily maintained under general anesthesia with propofol and remifentanil or sufentanil. Some cases utilized inhaled anesthetics, such as isoflurane or sevoflurane. For induction of general anesthesia, paralytic agents including rocuronium or succinylcholine as well as fentanyl were typically used. Resection usually occurred within 90 minutes of the start of the procedure.
After resection, tissue was placed within ~180 seconds in ice-cold slicing artificial aCSF. Samples were transported in sealed conditions for 15–35 minutes before being transferred to freshly oxygenated solution. Pia and surface blood vessels that would obstruct slicing were removed with forceps and samples were cut in small pieces (~3 mm × 3 mm) perpendicular (<5 degrees off) to the surface of the brain.
Epileptic rat preparation
Rats were implanted with a cannula and monopolar depth electrodes targeted to the hippocampus, as well as 4 skull screw electrodes (one posterior to lambda, one over the right frontal lobe, one over the left parietal lobe and one over the right parietal lobe). An unconnected anchor screw was placed over the left frontal lobe for implant stability. All electrodes were covered in dental cement and connected to our recording system using a PlasticsOne 6 channel connector.
Epilepsy was induced by administration of 200 ng of kainic acid solution (1mg/mL of kainic acid in 10× PBS) into the hippocampus via the cannula while the animal was awake using a syringe pump connected to an injector needle. The needle was left in place for 30s to allow proper diffusion and limit backflow of the solution. This would induce status epilepticus which was allowed to proceed for at most 2 hours before being halted with 5mg/kg diazepam. Animals were administered an NSAD (carprofen, 5mg / kg) daily for 3 days after the induction procedure. EEGs were monitored continuously to check for the onset of spontaneous focal seizures. Animals were euthanized and used for electrophysiological recordings 5 days after they experienced spontaneous focal seizures.
Patch-clamp recording
Patch-clamp recordings were performed from the soma and apical dendrites of pyramidal neurons at 34–36 °C in recording aCSF containing (in mM): sodium chloride 120, potassium chloride 3, sodium bicarbonate 25, sodium phosphate monobasic monohydrate 1.25, calcium chloride 1.2, magnesium chloride 1.2, glucose 11, sodium pyruvate 3, and sodium ascorbate 1, 302–305 mOsm, saturated with 95% O2 and 5% CO2.
Whole-cell current-clamp recordings were performed with an Axopatch 200B, MultiClamp 700b or a Dagan BVC-700A amplifier with series resistance fully balanced. Experiments were performed at the resting membrane potential. Patch pipettes from thick-wall glass (1.5 O.D., 0.75 I.D.) had resistances ranging from 3 to 15 MΩ, and capacitance was fully neutralized prior to break in. Series resistances ranged from 5–30 MΩ. The intracellular solution contained (in mM): potassium gluconate 134, potassium chloride 6, HEPES 10, sodium chloride 4, adenosine 5’-triphosphate magnesium 4, guanosine 5’-tri phosphate sodium 3, phosphocreatine di (tris) 14 and 0.1 Alexa 488. Liquid junction potential was not corrected for. Current and voltage signals were filtered at 10 kHz and acquired at 20 kHz.
Outside-out (8–13 MΩ pipettes with thick-wall glass) recordings were performed with an Axopatch 200B or a MultiClamp 700b amplifier. For a subset of recordings, the formation of an outside-out patch was confirmed under two-photon imaging (lack of cytoplasmic bridge). Nucleated patch (8–13 MΩ pipettes with thick-wall glass) recordings were performed with an Axopatch 200B or a MultiClamp 700b amplifier. For double nucleated patch experiments, the voltage-clamp amplifier was an Axopatch 200B and the current-clamp amplifier was a Dagan BVC-700A amplifier. Voltage-clamp recordings had series resistance and whole-cell capacitance predicted and compensated >90% and lag <10 μs to effectively command voltage (Extended Data Figure 9). The nucleus was sucked into the pipette, the pipette was withdrawn and the formation of an excised patch was confirmed under two-photon imaging (lack of cytoplasmic bridge). To record HCN channels, the voltage was stepped to −140 mV for 1000 ms followed by −60 mV for 1000 ms from a rest potential of −40 mV15. The protocol was interleaved with 4 1/10 scaled protocol for leak subtraction. To record voltage-gated potassium channels, the voltage was stepped to −110 mV for 500 ms followed by +40 mV for 400 ms from a rest potential of −60 mV13. The protocol was interleaved with 4 1/10 scaled protocol for leak subtraction. Current signals were filtered at 10 kHz and acquired at 20 kHz. Channel measurements were performed at physiological temperature unlike previous measurements of HCN and Kv in L5 neurons13,15,24.
For all experiments except Extended Data Figures 3h–j, we recorded from large L5 pyramids with thick apical dendrites reaching L125. As in previous rodent research, dendritic recordings from unlabeled cells were strongly biased towards thick apical dendrites that reliably originate from large L5 somas. In all species, we targeted the thickest dendrites and biggest L5 somas to isolate putative L5B neurons, also referred to as “extra-telencephalic” or ET4,8,9,13,15,26,27
Two-photon imaging
A multiphoton microscope system with a Mai-Tai DeepSee laser was used to image Alexa 488 at 920 nm or Alexa 594 at 880 nm (separated via dichroic mirrors to independent sets of GaAsP photosensor modules). Another photosensor module was used to collect transmitted-light Dodt gradient images. Laser beam intensity was independently controlled with electro-optical modulators. For some recordings, two-photon imaging was used to target a second location following initial somatic or dendritic recording.
Compartmental modeling
We use a biophysical model of a rat L5 neuron to test the validity of our conductance and outside-out surface areas. Simulations were performed in NEURON 7.8.228. We employed a previously published rat neocortical L5 pyramidal neuron morphology and removed the axon29. We implemented the three conductances (HCN, Kv peak, and Kv plateau) based on our measurements (Figure 3). Leak conductance (reversal −92 mV) was set to 2 pS/μm2 in the soma and basal dendrites,1.54 pS/μm2 in apical dendrites and 2.91 pS/μm2 in the tuft. Axial resistance was set to 100 Ω*cm in the soma, 100 Ω*cm in the basal dendrites, 250 Ω*cm in the apical dendrites, and 25 Ω*cm in the tuft. Specific membrane capacitance was set to 1 μF/cm2 in the soma, 1 μF/cm2 in the basal dendrites, 2 μF/cm2 in the apical dendrites, and 1 μF/cm2 in the tuft. Current injection and voltage measurements were simulated at the soma and 520 μm from the soma (distal measurement). Outside-out patches were simulated as spherical compartments with surface areas of 50 μm (Extended Data Figure 9); and all command voltage protocols were matched to the experimental protocols. All simulations were conducted at 37°C.
Nissl staining
Shrews, gerbils, mice, rats, ferrets, guinea pigs, rabbits and marmosets were anesthetized as described above and perfused transcardially with phosphate-buffered saline (PBS) and 4% paraformaldehyde (PFA) in PBS. Whole brains or sections containing the regions of interests were then placed in 4% PFA at 4°C for 24 hours. Macaque and human brain samples were resected under anesthesia and placed directly in 4% PFA for at 4°C 24 hours. Brain samples were then transferred to PBS at 4°C until slicing. Brain samples were dissected and tissue blocks were mounted on the vibratome stage in the same fashion as samples used for electrophysiological recordings. Particular attention was paid to the angle of slicing to allow for proper comparisons. 50–60 pm slices were prepared and transferred to 10% formalin for 10 days. Brain slices were mounted on targeting molecule polysine-coated slides and dried for 2–3 weeks. They were first cleaned with xylene, dehydrated with 100% ethanol, defatted with chloroform (1:1 ratio dilution with 100% ethanol), and rehydrated before staining.
For a reliable stains of Nissl bodies and a better visualization of cell bodies, a 0.025% buffered acid thionin stain was used30,31. First, 1% thionin was dissolved in distilled water and filtered. Sodium acetate and acetic acid solution were then added and pH adjusted to 5.1–5.5. Thionin buffer solution was kept in dark, maintained under agitation, and temperature was kept at 37°C before use. Brain slices were placed in thionin buffer solution for 2–5 min before being rinsed in distilled water to remove excessive dyes. Further color differentiation was performed with 70% ethanol with acetic acid until the desirable color and intensity were obtained. To reduce the speed of differentiation, brain slices were transferred to 95% ethanol, and went through the dehydration processes again. Finally, brain slices were cleared in xylene before being covered with DPX and a coverslip. Slices were imaged at 2.5X and 10X with a Zeiss LSM 900.
Conductance density estimation
We devised methods to estimate the membrane area of our outside-out patches. For outside-out surface area, we first used the nucleated patch technique to determine the current per unit area of the somatic membrane of rat neurons (Extended Data Figure 9). After calibration, we sampled outside-out patches from the same compartment and estimated an outside-out surface area of 50.42 μm2 (Extended Data Figure 9). While our estimate is larger than a prior estimate using capacitive measurements32, it is worth noting that the specific value used here does not impact cross-species conductance comparisons, which are all relative. Using the channels’ reversal potentials15,24, outside-out measurements were effectively converted into conductance densities (Figure 3e). We validated that our conductance estimates were reasonable using a morphologically-realistic biophysical model (Extended Data Figure 9).
Quantification and statistical analysis
Analysis of voltage and current waveforms was performed using MATLAB codes performing the operations detailed below. Signals were low-pass filtered at 2.5 kHz for outside-out recordings and nucleated patch recordings. Outside-out recording traces were low-pass filtered at 100 Hz for display in figures. Input resistance was calculated from the slope of the I-V relationship in response to hyperpolarizing current injections. Voltage sag was calculated as (peak-steady state)/peak for current injection of −500 pA or −250 pA for Etruscan shrew neurons due to their very high input resistances. Spike full-width at half-max and area were computed using the base (calculated as the lowest voltage where the first derivative crossed 2 V/s) and the absolute peak of the spike. Previously published rat and human data analyzed the same way were included in the larger datasets here4. Distal dendrites and proximal dendrites were 10–50% and 82–94% of somatic depth, respectively. The corresponding physical distances from the soma have the following ranges for distal (mouse 280–400 μm, gerbil 400–490 μm, rat 420–670 μm, guinea pig 580–909 μm, rabbit 734–1000 μm, human 900–1638 μm) and proximal (mouse 30–80 μm, gerbil 75–150 μm, rat 90–150 μm, guinea pig 125–150 μm, rabbit 107–190 μm, human 200–300 μm) dendrites. Reversal potentials were −30.7 mV for HCN15, −69.9 mV for Kv peak and −85.5 for Kv plateau24. The end of the somatic compartment was defined as half the maximal width of the soma away from the maximal width of the soma. The end of the apical dendrite used for conductance estimation was 30% of the somatic depth. Cortical neuronal density (Extended Data Table 1) were converted to neurons per μm3 for Figure 4h using the brain specific density (1.036 g/cm3)33.
For nucleated patches, the central (biggest) cross-section was used to compute the major and minor axes from two-photon stacks (~ 0.1 × 0.1 μm resolution; 0.5–1 μm steps). The surface area (A) was calculated as (π/4)*(major axis + minor axis). Morphological width measurements were performed after the patch pipette was removed. From two-photon stacks (1 μm steps) with variable zoom depending on the size of the region of interest, the central (brightest) cross-section was isolated. The image was rotated such that the soma and/or dendrite is vertical. Pixel intensity for segments of 2–10 μm were averaged and the full width at half max was computed as an estimate of the width. In calculating surface areas, the width was multiplied by the number of branches for dendrites post-branching points. Z-stack montage images were constructed using ImageJ on two-dimensional maximal intensity projections of 1–2 μm Z-series collected at the end of the experiment.
Statistical analysis was performed in MATLAB. D’Agostino-Pearson tests were used to assess normality. For normal data, results are presented as mean ± SEM, and ANOVA or two-sided t-test were used for statistical analyses. For most skewed datasets, box plots denote the median and 25–75th percentiles, and two-sided Wilcoxon rank sum test or Kruskal-Wallis were used for statistical analysis. Median and 95% confidence intervals obtained with bootstrapping are presented for firing rates and interspike intervals as a function of injected current. No repeated measurements were used in this study. Statistical details can be found in the figure legends and in the main text. Reported n values can be found in the figure legends and in the results.
Extended Data
Extended Data Figure 1. Histological identification of cortical layers, related to Figure 1.
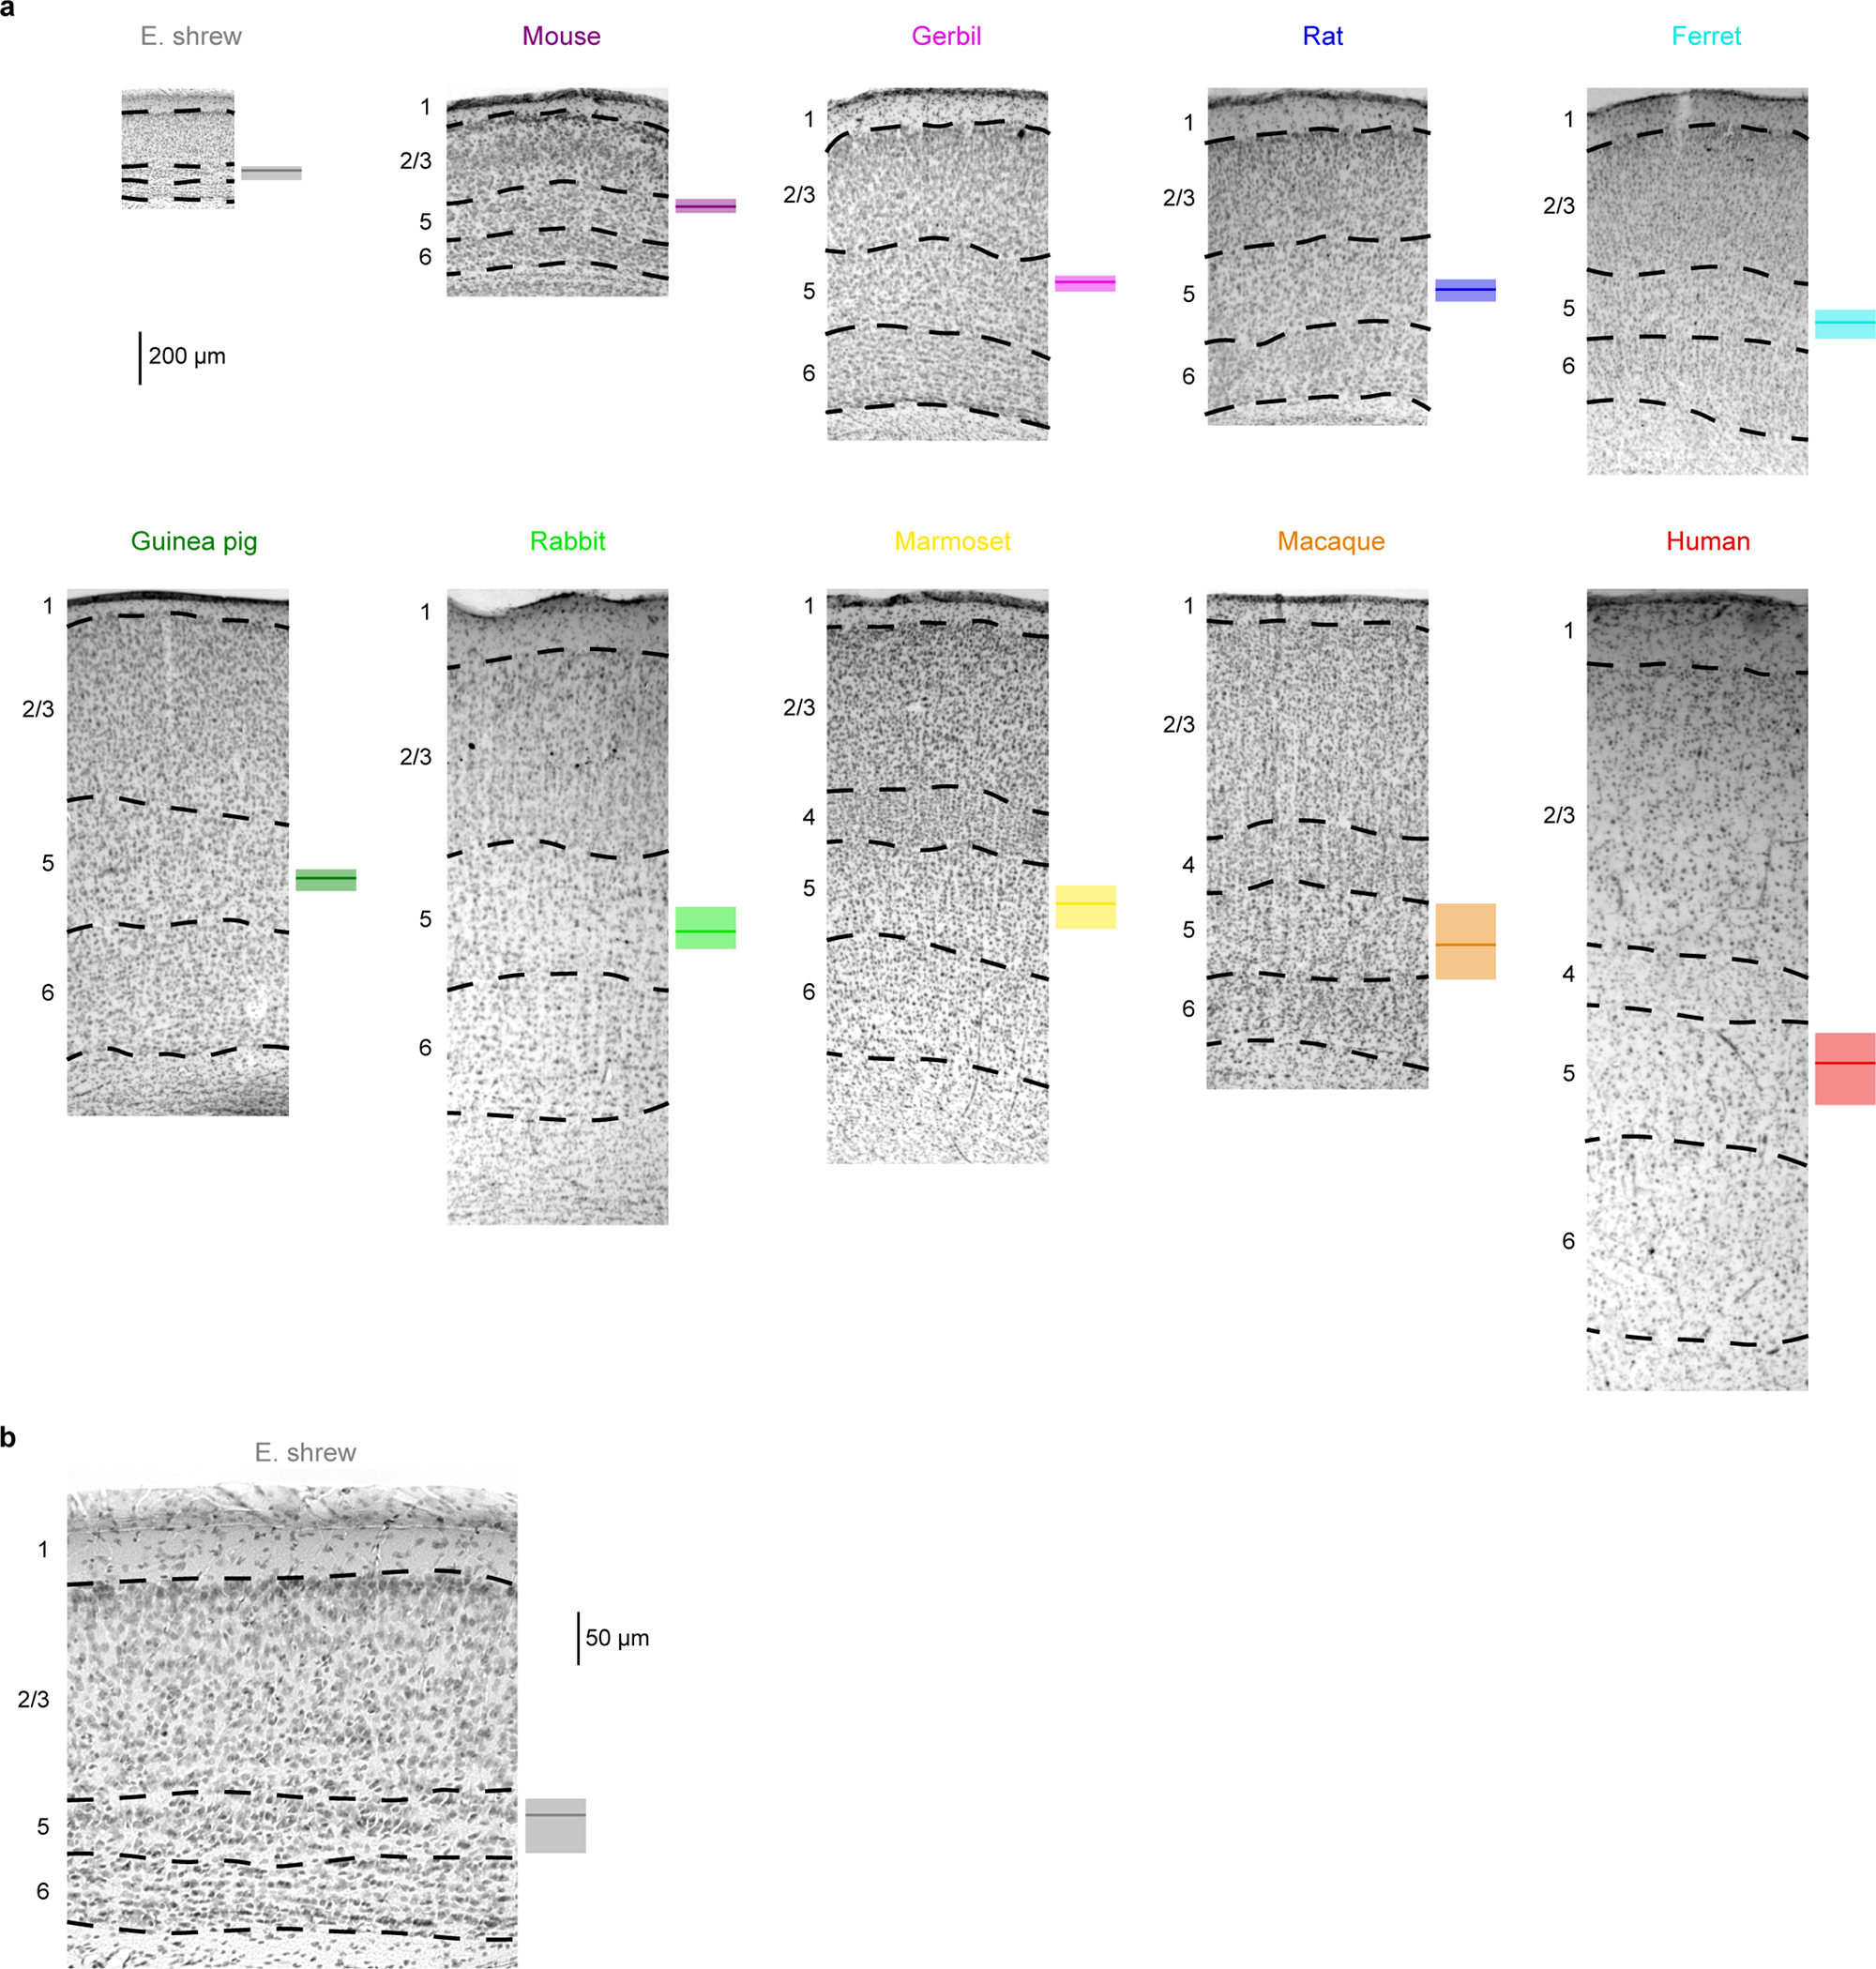
a, Nissl-stained brain slices from the 10 species with labeled cortical layers. Box plots on the right of individual slices denote the median and 25–75th percentiles of somatic depth for electrophysiological recordings (Etruscan shrew n = 39, mouse n = 162, gerbil n = 105, rat n = 215, ferret n = 31, guinea pig n = 118, rabbit n = 87, marmoset n = 41, macaque n = 34, human n = 208).
b, The shrew slice from a, expanded to show detail (n = 39).
Extended Data Figure 2. Somatic impedance profiles and voltage sag, related to Figure 1.
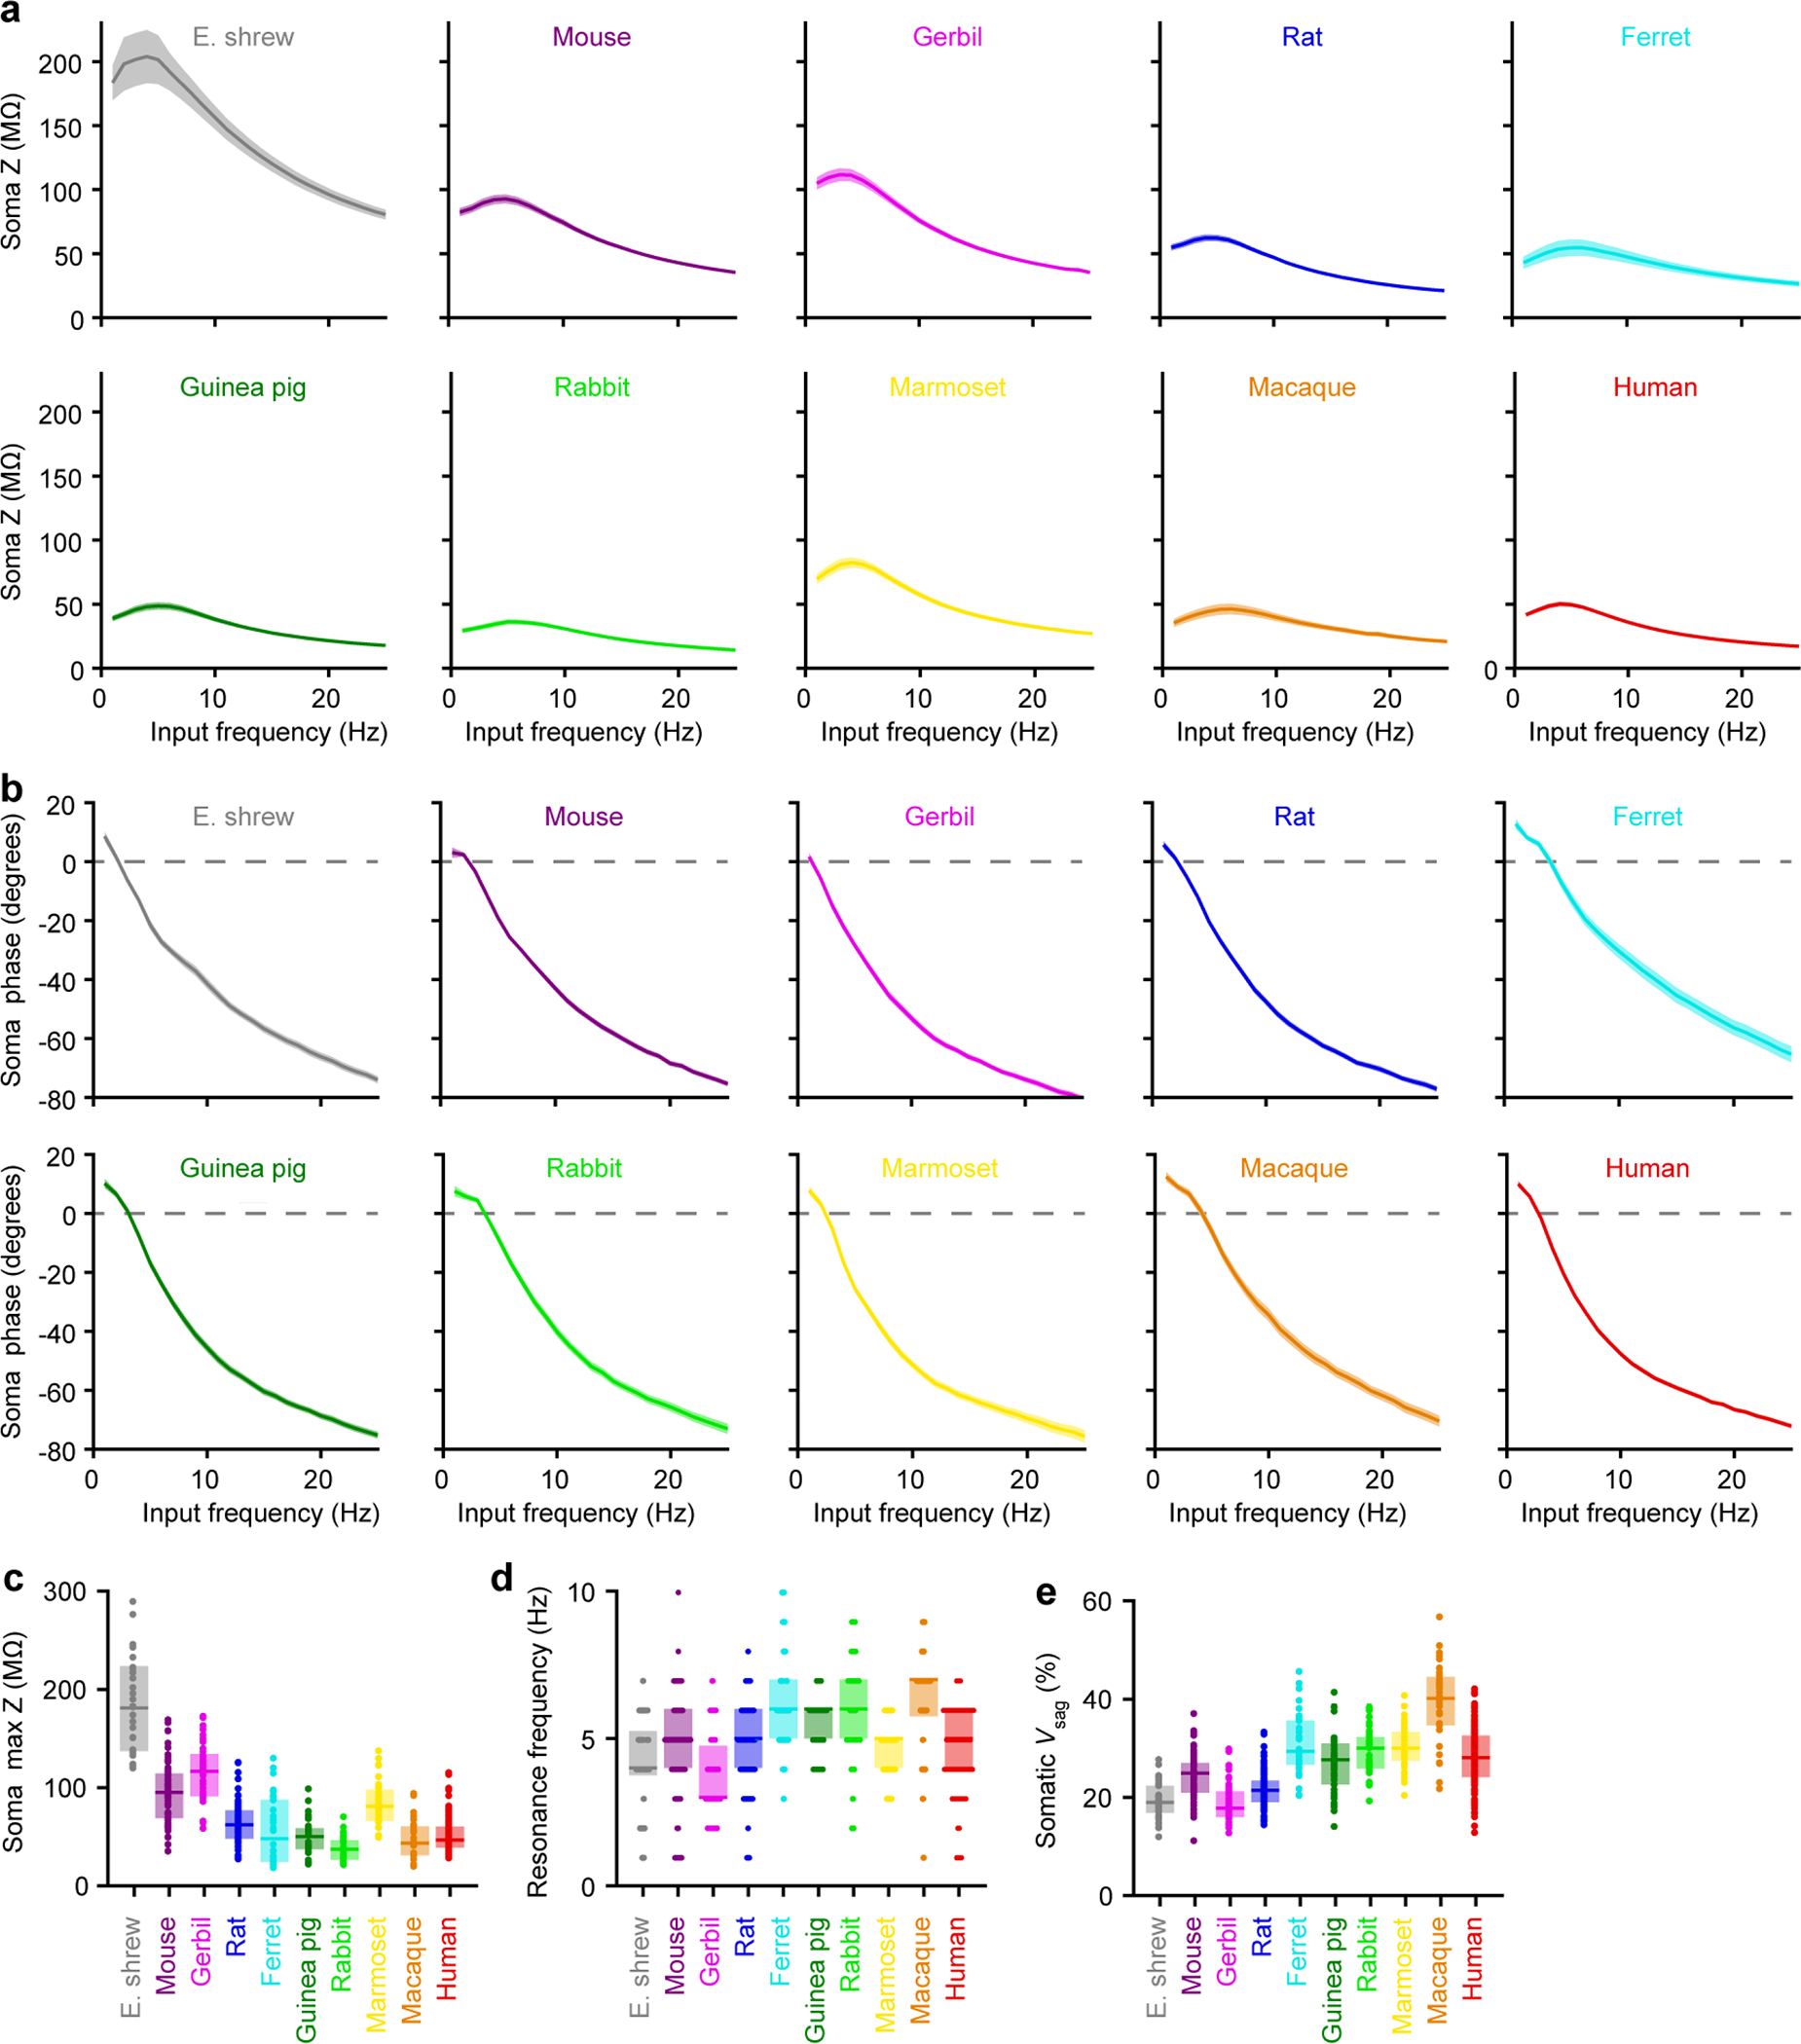
a-d, Somatic impedance profiles (Etruscan shrew n = 29, mouse n = 71, gerbil n = 39, rat n = 64, ferret n = 28, guinea pig n = 35, rabbit n = 37, marmoset n = 30, macaque n = 25, human n = 100). Pooled data represent mean ± SEM for a-b. Box plots denote the median and 25–75th percentiles for c-d.
a, Impedance profile in response to sinewaves of 50–100 pA injected at the indicated frequencies for 2 seconds.
b, Phase offset between the voltage response and the injected current.
c, Maximal impedance (p < 10−49 Kruskal-Wallis; χ2 = 259 & 9 df).
d, Resonance frequency (p < 10−13 Kruskal-Wallis; χ2 = 81 & 9 df). Data points displayed as a beeswarm plot to show overlapping integers.
e, Somatic voltage sag (p < 10−57 Kruskal-Wallis, χ2 = 298 & 9 df; Etruscan shrew n = 39, mouse n = 85, gerbil n = 58, rat n = 117, ferret n = 31, guinea pig n = 47, rabbit n = 40, marmoset n = 41, macaque n = 34, human n = 126). Box plots denote the median and 25–75th percentiles.
Extended Data Figure 3. Somatic firing properties, related to Figure 1.
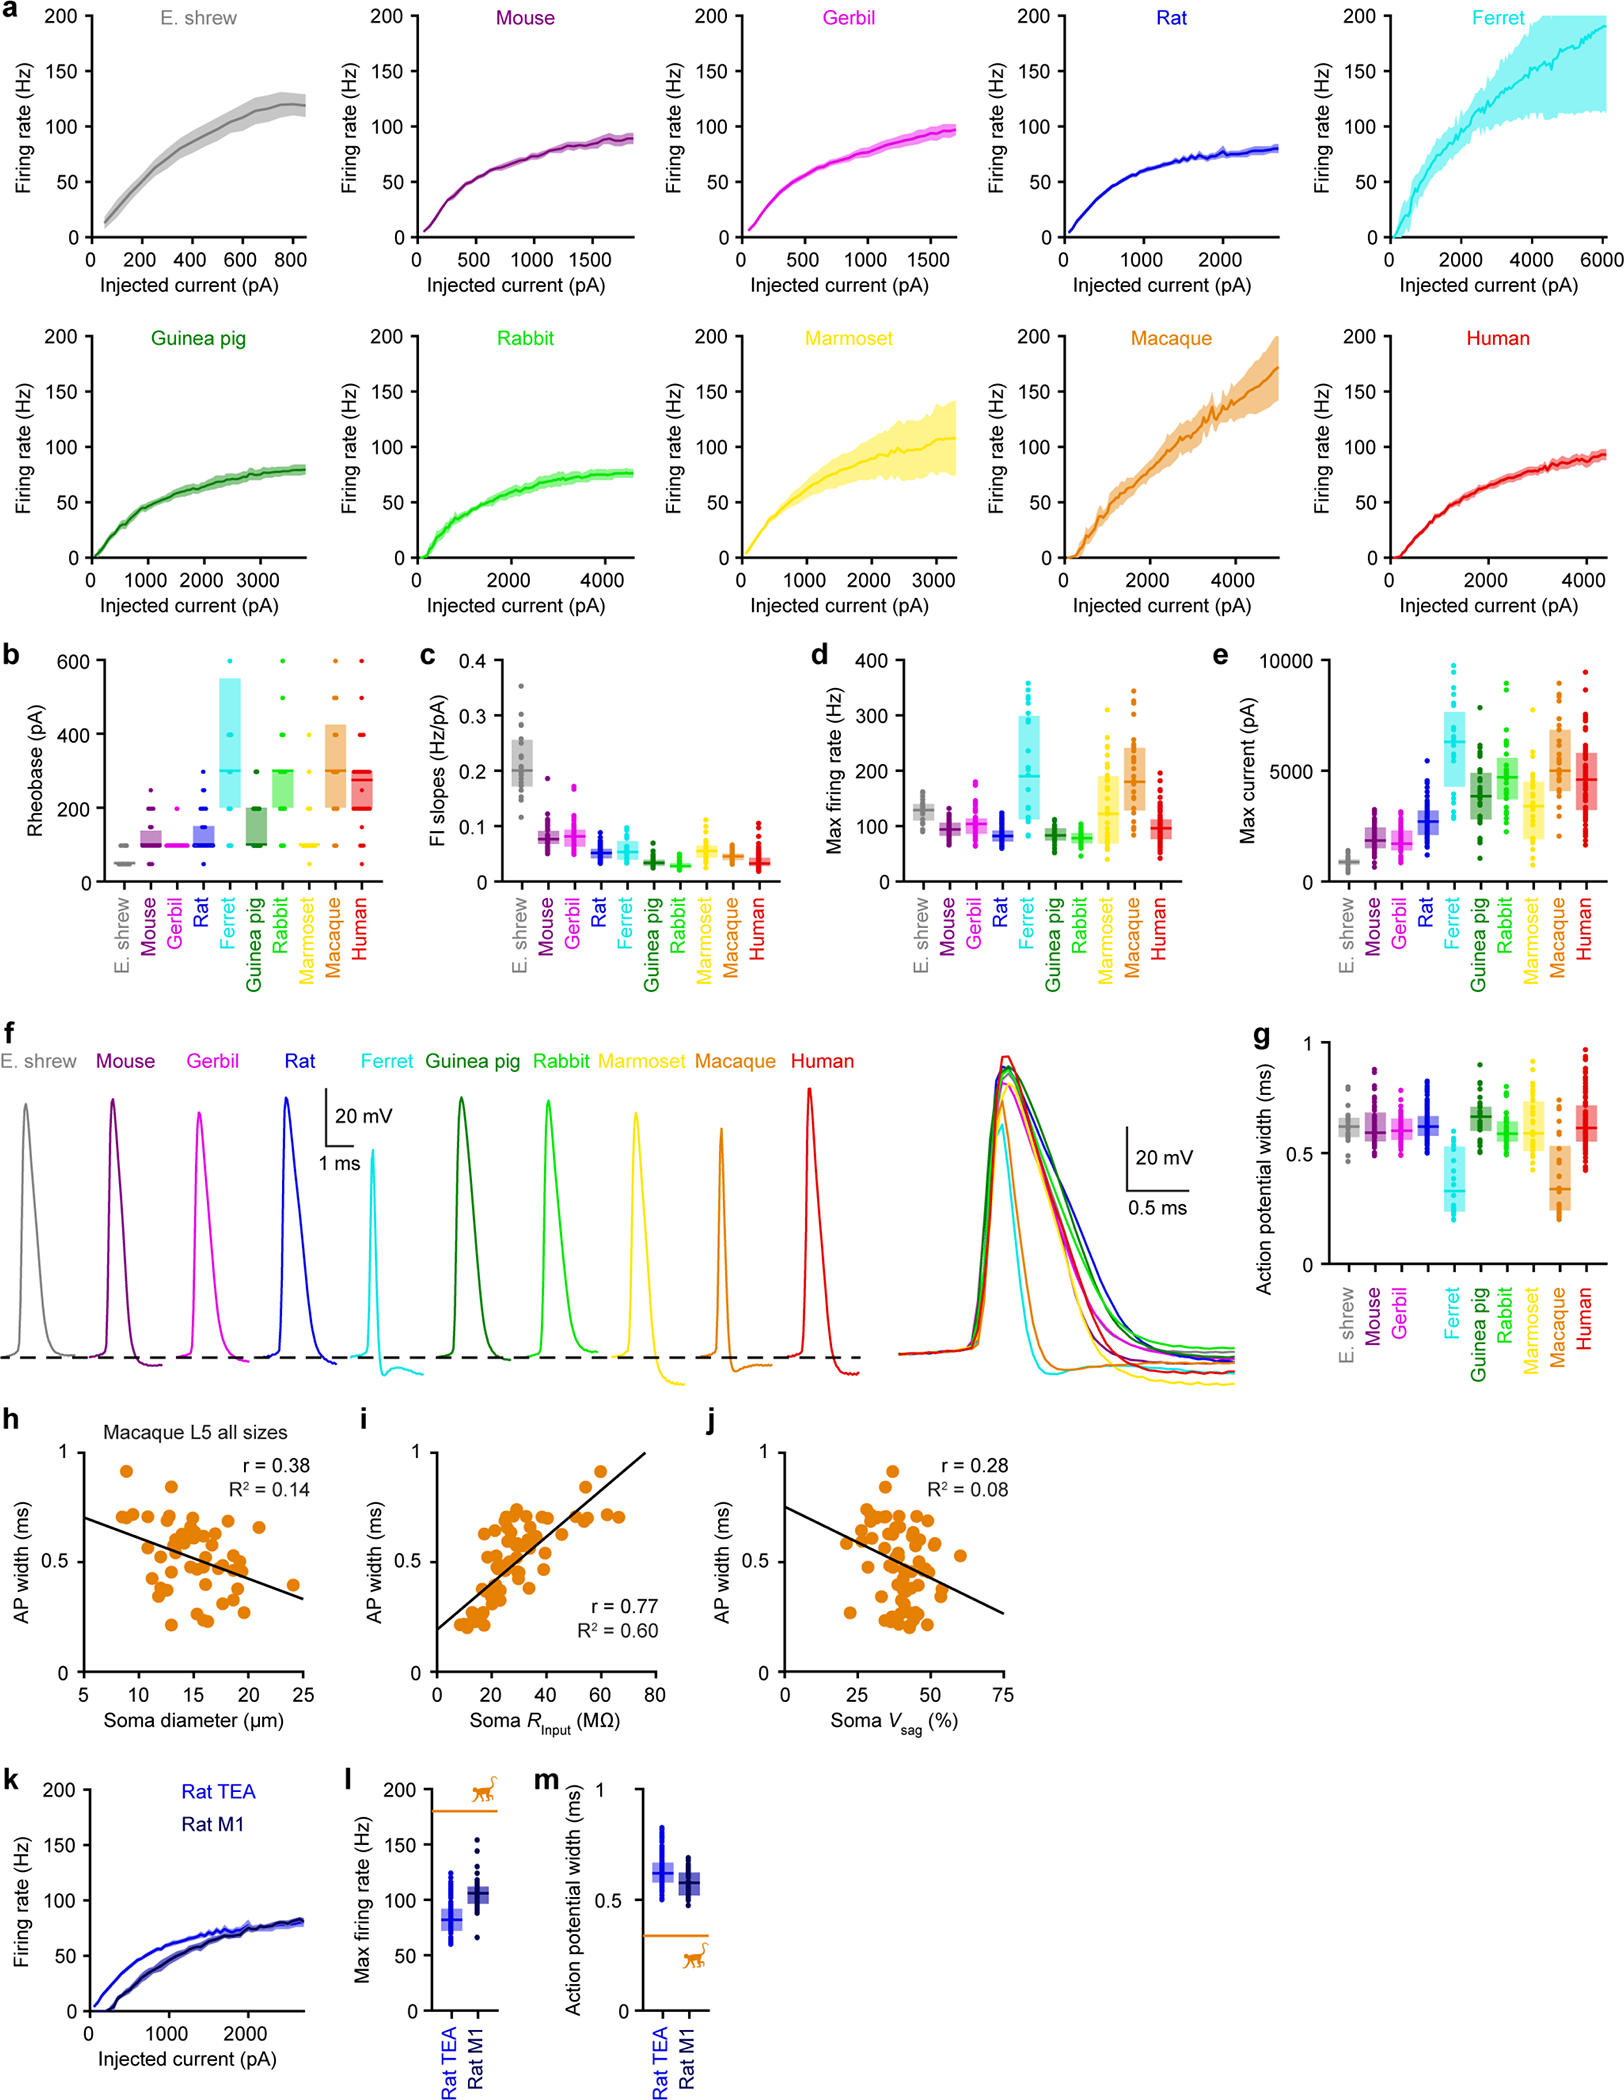
Somatic firing properties (Etruscan shrew n = 22, mouse n = 59, gerbil n = 46, rat n = 93, ferret n = 23, guinea pig n = 30, rabbit n = 33, marmoset n =34, macaque n = 29, human n = 104).
a, Firing rates as a function of injected current. The lines and shaded error bars represent population medians and 95% confidence intervals.
b-g, Box plots denote the median and 25–75th percentiles.
b, Rheobase (p < 10−47 Kruskal-Wallis, χ 2 = 250 & 9 df). Data points displayed as a beeswarm plot to show overlapping integers.
c, Slope of firing rate-current relationship (p < 10−59 Kruskal-Wallis, χ 2 = 304 & 9 df).
d, Maximal firing rate (p < 10−26 Kruskal-Wallis, χ 2 = 146 & 9 df).
e, Maximal current eliciting action potentials before entering depolarization block (p < 10−54 Kruskal-Wallis, χ 2 = 283 & 9 df).
f, Representative action potential waveforms.
g, Width of first action potential at rheobase (p < 10−13 Kruskal-Wallis, χ 2 = 86 & 9 df).
h-j, Correlation between action potential width (at rheobase) and other parameters for macaque L5 neurons of different somatic sizes (not restricted to large L5 with thick dendrites).
h, Correlation with soma diameter (R2 = 0.145, p = 0.006, linear regression, F = 8.3 & 49 df, n = 51).
i, Correlation with soma input resistance (R2 = 0.596, p < 10−13, linear regression, F = 94.5 & 64 df, n = 66).
j, Correlation with soma voltage sag (n = 66; R2 = 0.079, p = 0.02, linear regression, F = 5.5 & 64 df, n = 66).
k-m, Rat somatic firing properties of L5b neurons in TEA (n = 93) versus M1 (n = 39). Orange lines represent median thick L5 macaque data from Extended Data Figure 3.
k, Firing rates as a function of injected current. The lines and shaded error bars represent population medians and 95% confidence intervals.
l, Maximal firing rate (p < 10−8, two-sided Wilcoxon rank sum, Z = −5.93).
m, Width of first action potential at rheobase (p < 10−3, two-sided Wilcoxon rank sum, Z = 3.34).
Extended Data Figure 4. Somatic bursting properties, related to Figure 1.
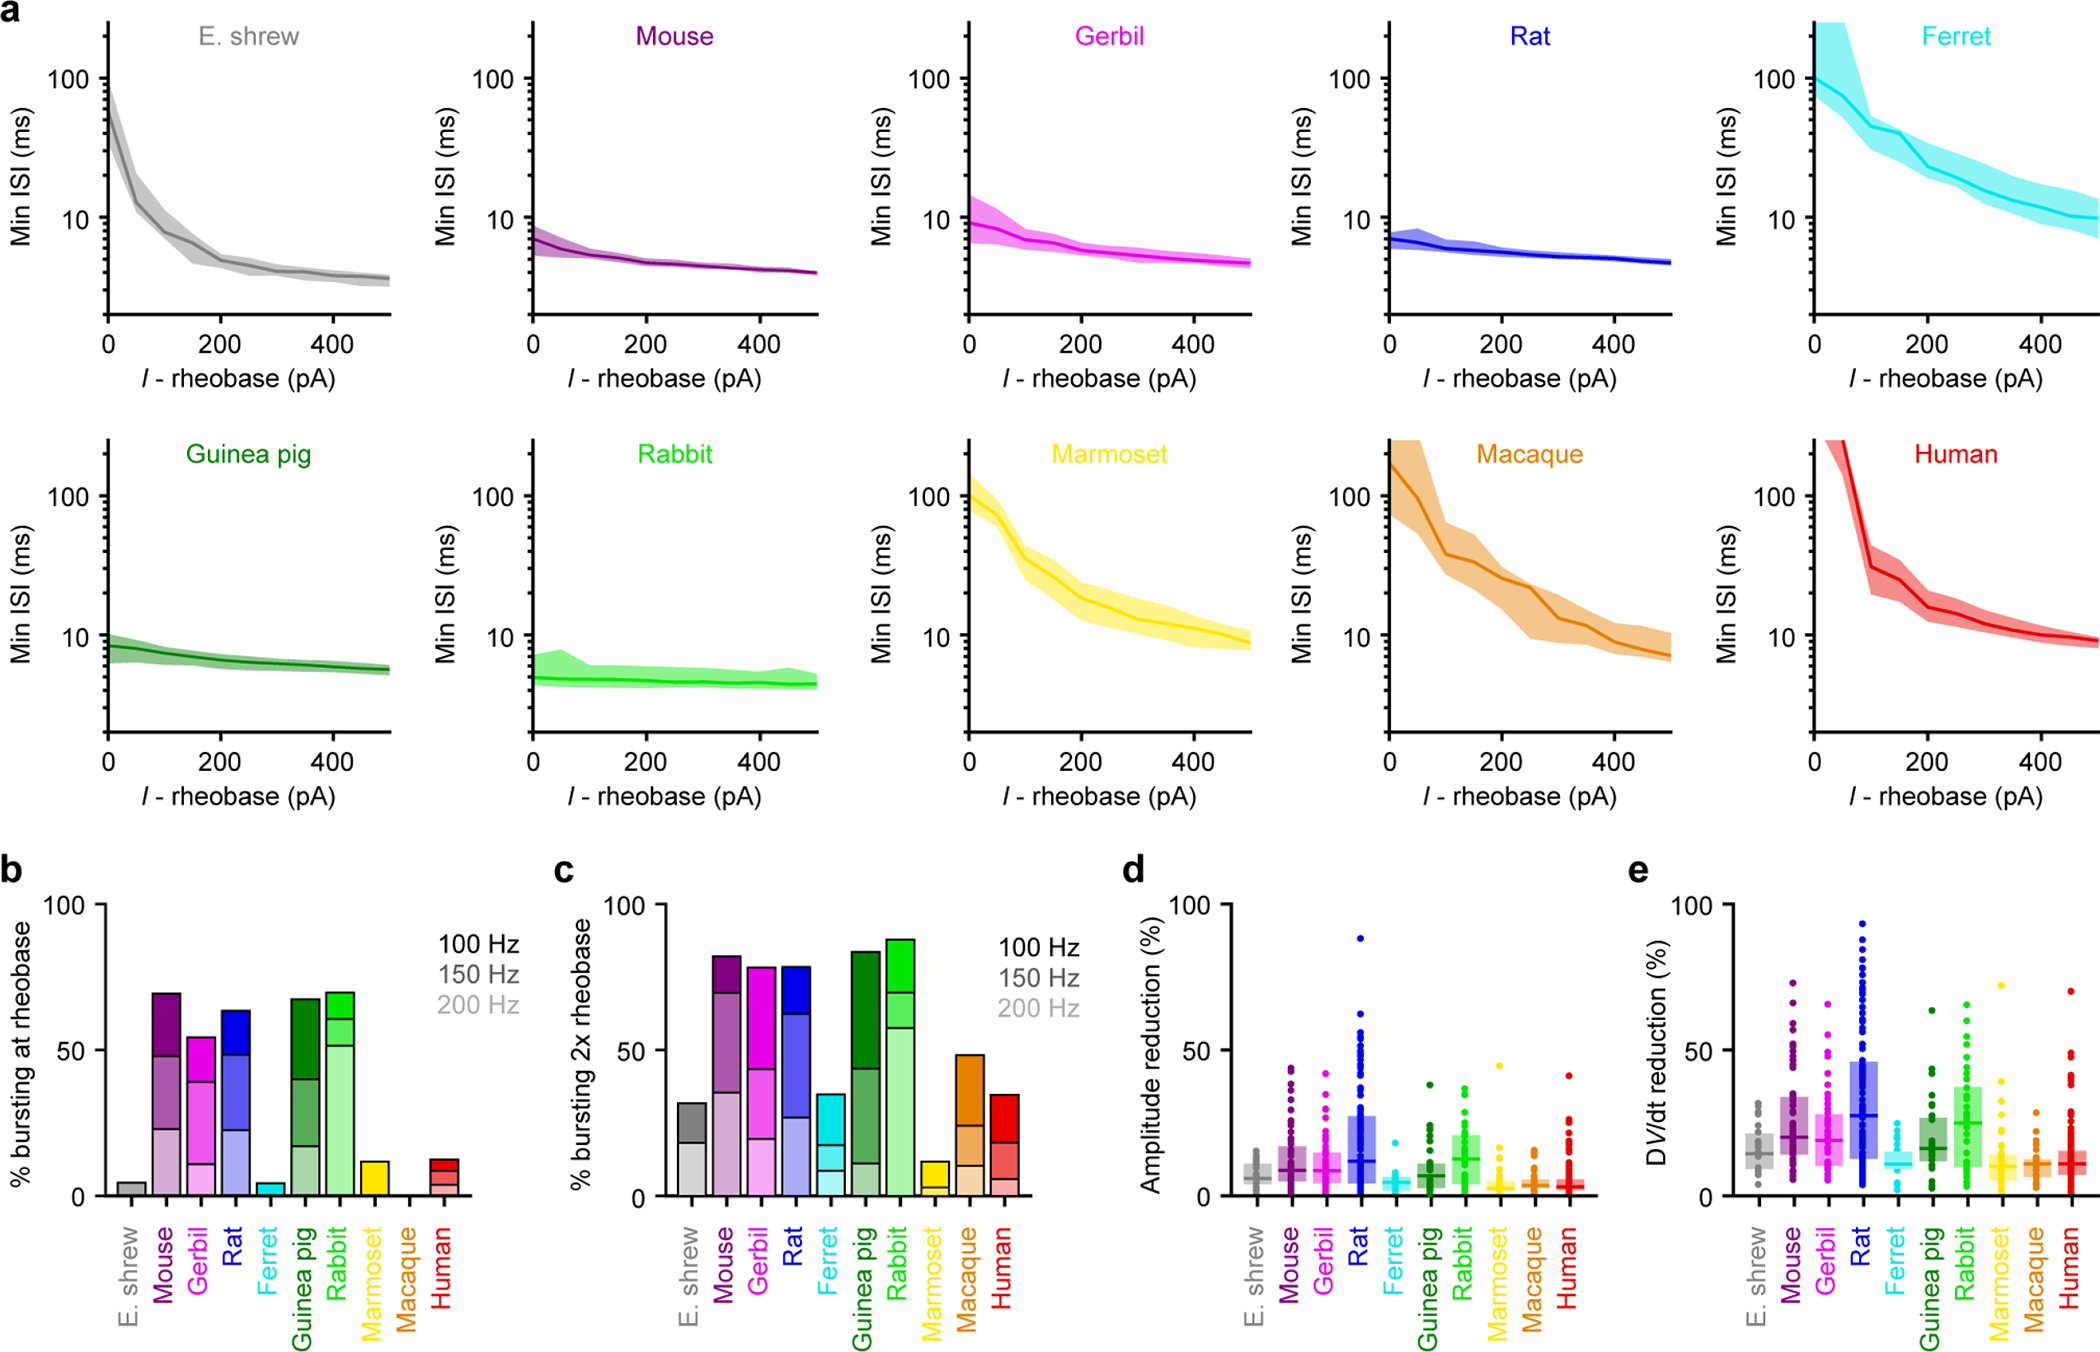
Somatic bursting properties (Etruscan shrew n = 22, mouse n = 59, gerbil n = 46, rat n = 93, ferret n = 23, guinea pig n = 30, rabbit n = 33, marmoset n = 34, macaque n = 29, human n = 104).
a, Minimum instantaneous interspike interval (ISI) on a log scale as a function of injected current above rheobase. The lines and shaded error bars represent population medians and 95% confidence intervals.
b, Percentage of neurons exhibiting bursts with different frequency thresholds at rheobase.
c, Same as b but at double the rheobase.
d-e, Box plots denote the median and 25–75th percentiles.
d, Maximal action potential amplitude reduction (p < 10−18 Kruskal-Wallis, χ 2 = 107 & 9 df).
e, Maximal action potential d Wdt reduction (p < 10−15 Kruskal-Wallis, χ 2 = 95 & 9 df).
Extended Data Figure 5. Dendritic impedance profiles, related to Figure 2.
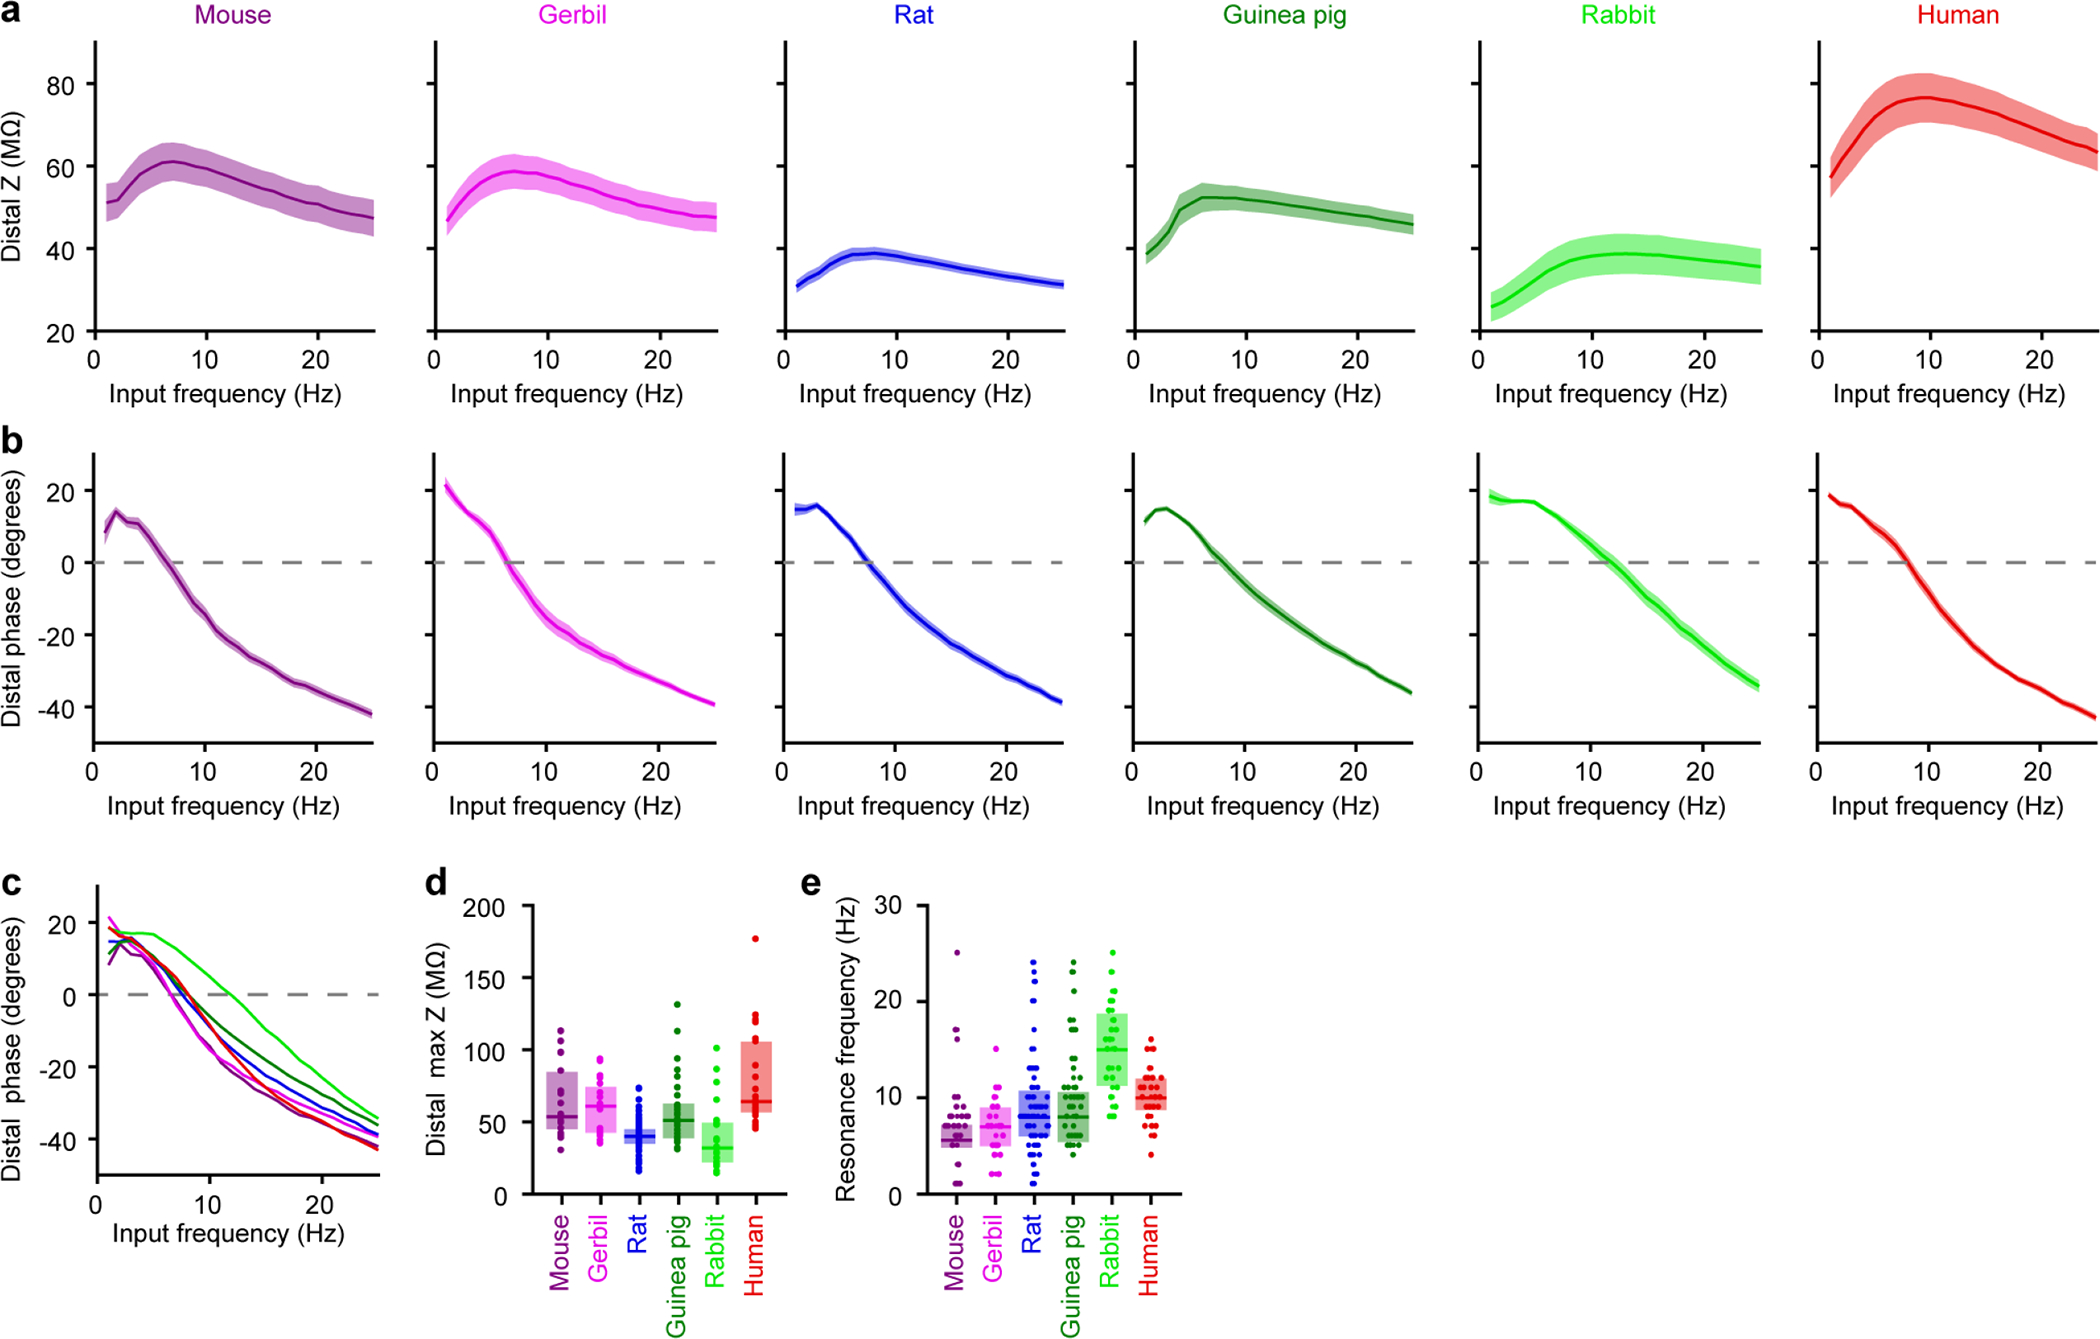
Dendritic impedance profiles (mouse n = 26, gerbil n = 19, rat n = 59, guinea pig n = 37, rabbit n = 23, human n = 25). Pooled data represent mean ± SEM for a-b. Box plots denote the median and 25–75th percentiles for d-e.
a, Impedance profile in response to sinewaves of 50–100 pA injected at the indicated frequencies for 2 second.
b, Phase offset between the voltage response and the injected current.
c, Mean data from b.
d, Maximal impedance (p < 10−10 Kruskal-Wallis, χ 2 = 59 & 5 df).
e, Resonance frequency (p < 10−6 Kruskal-Wallis, χ 2 = 39 & 5 df). Data points displayed as a beeswarm plot to show overlapping integers.
Extended Data Figure 6. Additional dendritic properties, related to Figure 2.
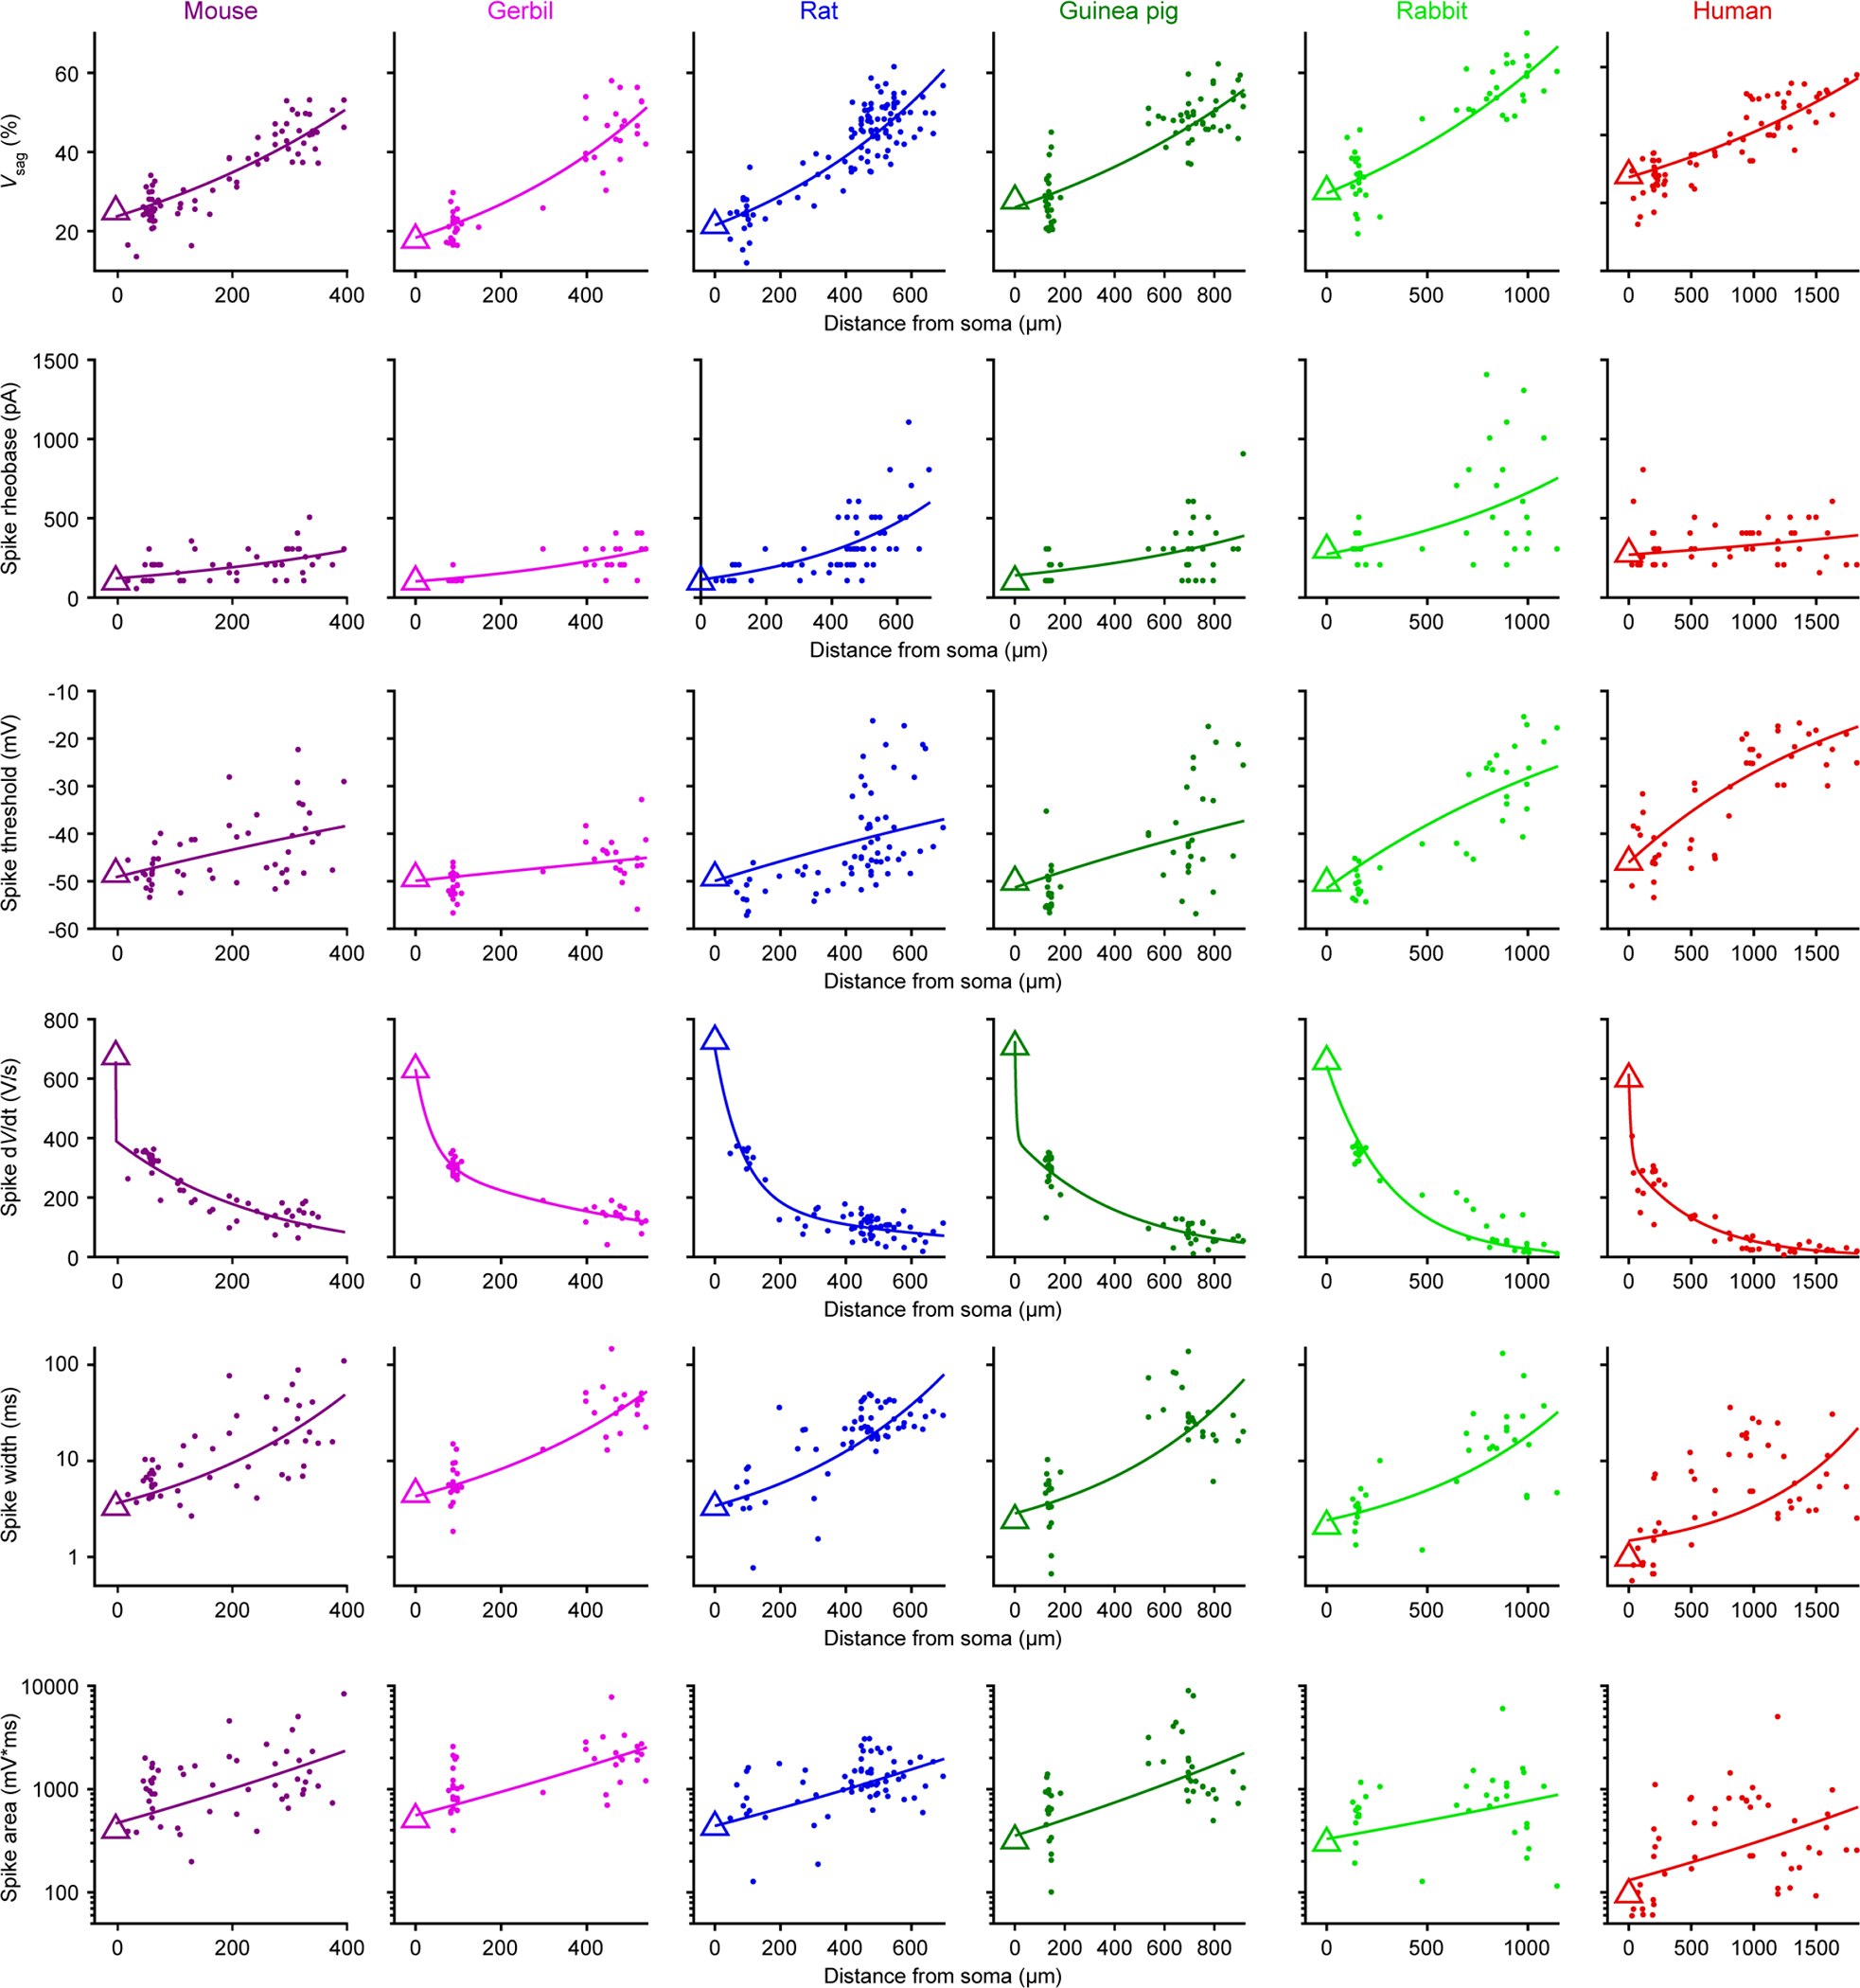
Voltage sag (mouse n = 76, gerbil n = 47, rat n = 108, guinea pig n = 71, rabbit n = 47, human n = 72), resting membrane potential (mouse n = 76, gerbil n = 47, rat n = 108, guinea pig n = 71, rabbit n = 47, human n = 72), and spike properties (mouse n = 51, gerbil n = 40, rat n = 65, guinea pig n = 45, rabbit n = 35, human n = 49) as a function of distance from the soma. Triangles are somatic medians. Lines are exponential fit to the data or double exponential fit for spike dWdt. Spike width and area are on a log scale.
Extended Data Figure 7. Proximal dendritic properties and additional distal dendritic properties, related to Figure 2.
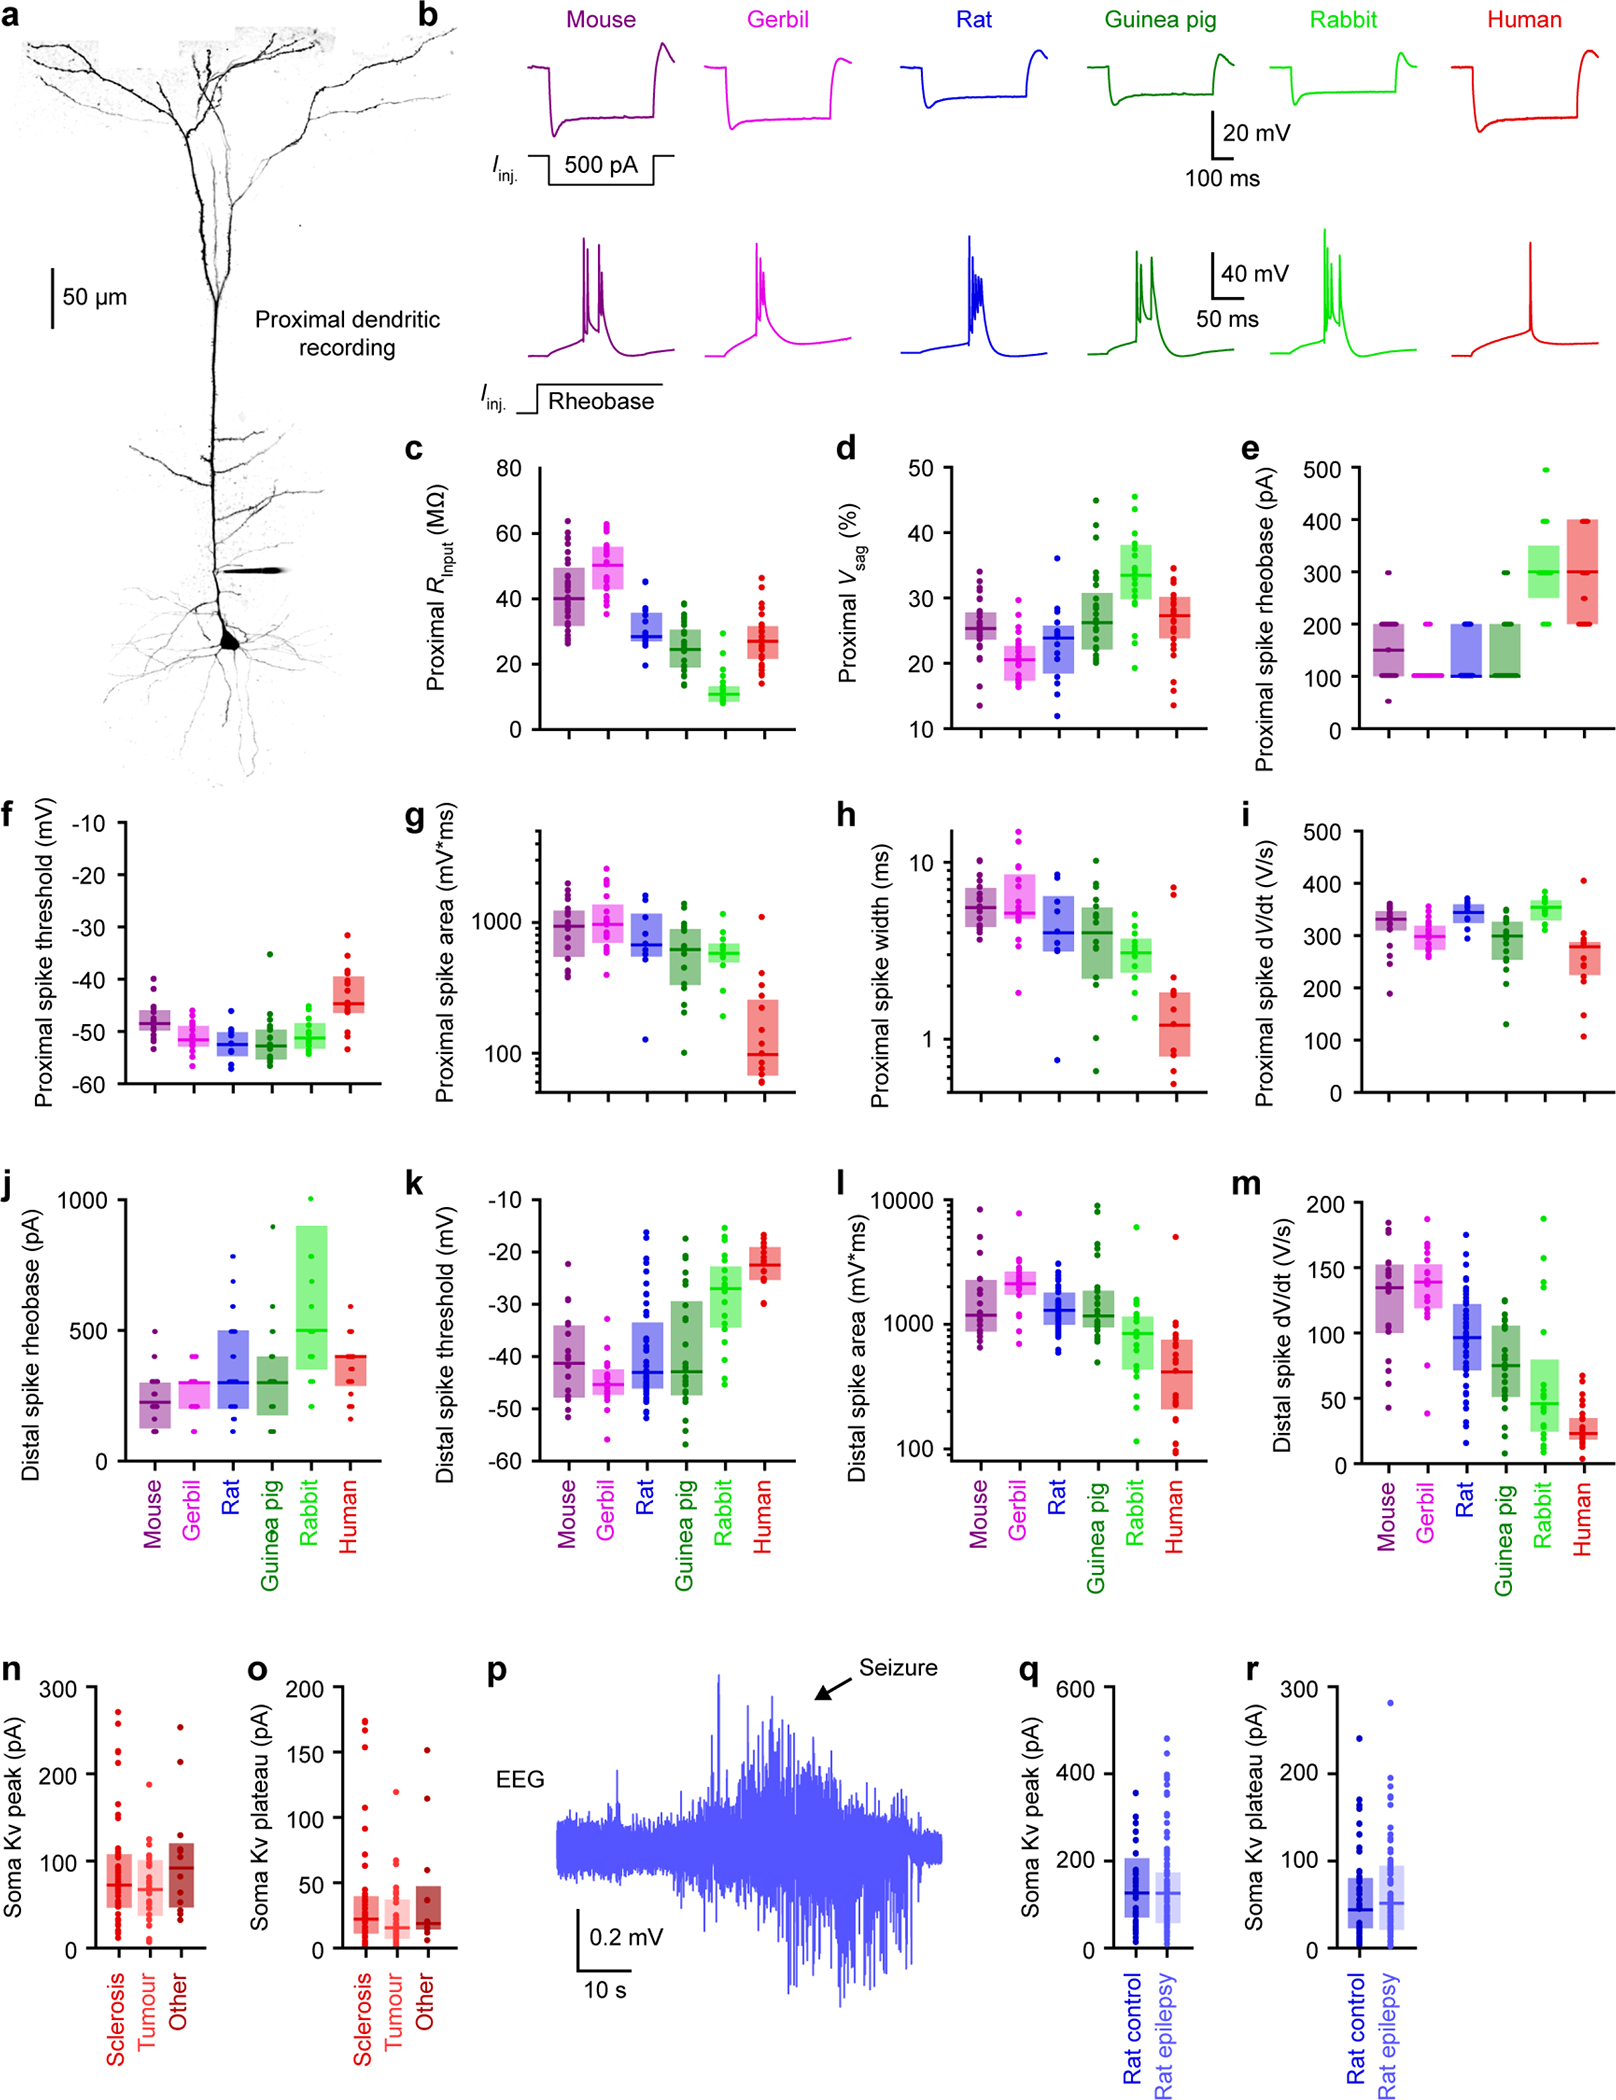
a, Two-photon Z-stack montage image of mouse neuron with a proximal patch-clamp electrode 63 μm from soma.
b, Proximal dendritic voltage in response to subthreshold (top) or threshold (bottom) step current injections.
c-d, Subthreshold properties of proximal dendrites (mouse n = 31, gerbil n = 23, rat n = 19, guinea pig n = 28, rabbit n = 21, human n = 27). Box plots denote the median and 25–75th percentiles.
c, Proximal input resistance (p < 10−18 Kruskal-Wallis, χ 2 = 98 & 5 df).
d, Proximal voltage sag (p < 10−8 Kruskal-Wallis, χ 2 = 47 & 5 df).
e-i, Suprathreshold properties of proximal dendrites. (mouse n = 19, gerbil n = 20, rat n = 9, guinea pig n = 18, rabbit n = 12, human n = 15). Box plots denote the median and 25–75th percentiles.
e, Proximal rheobase (p < 10−9 Kruskal-Wallis, χ2 = 51 & 5 df). Data points displayed as a beeswarm plot to show overlapping integers.
f, Proximal spike threshold (p < 10−4 Kruskal-Wallis, χ2 = 31 & 5 df).
g, Proximal spike area on a log scale (p < 10−6 Kruskal-Wallis, χ2 = 36 & 5 df).
h, Proximal spike width on a log scale (p < 10−5 Kruskal-Wallis, χ2 = 36 & 5 df).
i, Proximal maximum spike d Wdt (p < 10−5 Kruskal-Wallis, χ2 = 35 & 5 df).
j-m, Additional suprathreshold properties of distal dendrites (mouse n = 18, gerbil n = 19, rat n = 47, guinea pig n = 25, rabbit n = 20, human n = 25). Box plots denote the median and 25–75th percentiles.
j, Distal rheobase (p < 10−4 Kruskal-Wallis, χ2 = 28 & 5 df). Data points displayed as a beeswarm plot to show overlapping integers.
k, Distal spike threshold (p < 10−11 Kruskal-Wallis, χ2 = 61 & 5 df).
l, Distal spike area on a log scale (p < 10−10 Kruskal-Wallis, χ2 = 58 & 5 df).
m, Maximum distal spike dWdt (p < 10−13 Kruskal-Wallis, χ2 = 74 & 5 df).
n-o, Somatic outside-out currents in sclerosis (n = 44), tumour (n = 30) and others (n = 12). Box plots denote the median and 25–75th percentiles.
n, Somatic Kv peak currents (p = 0.39 Kruskal-Wallis, χ 2 = 190 & 2 df).
o, Somatic Kv plateau currents (p = 0.35 Kruskal-Wallis, χ 2 = 2.09 & 2 df).
p, Example EEG recording of epileptic seizure in rat kainic acid model.
q-r, Somatic outside-out currents in control (n = 80) and epileptic (n = 68) rats. Box plots denote the median and 25–75th percentiles.
q, Somatic Kv peak currents (p = 0.65, two-sided Wilcoxon rank sum, Z = 0.45).
r, Somatic Kv plateau currents (p = 0.525, two-sided Wilcoxon rank sum, Z = 0.64).
Extended Data Figure 8. Additional conductance measurements, related to Figure 3.
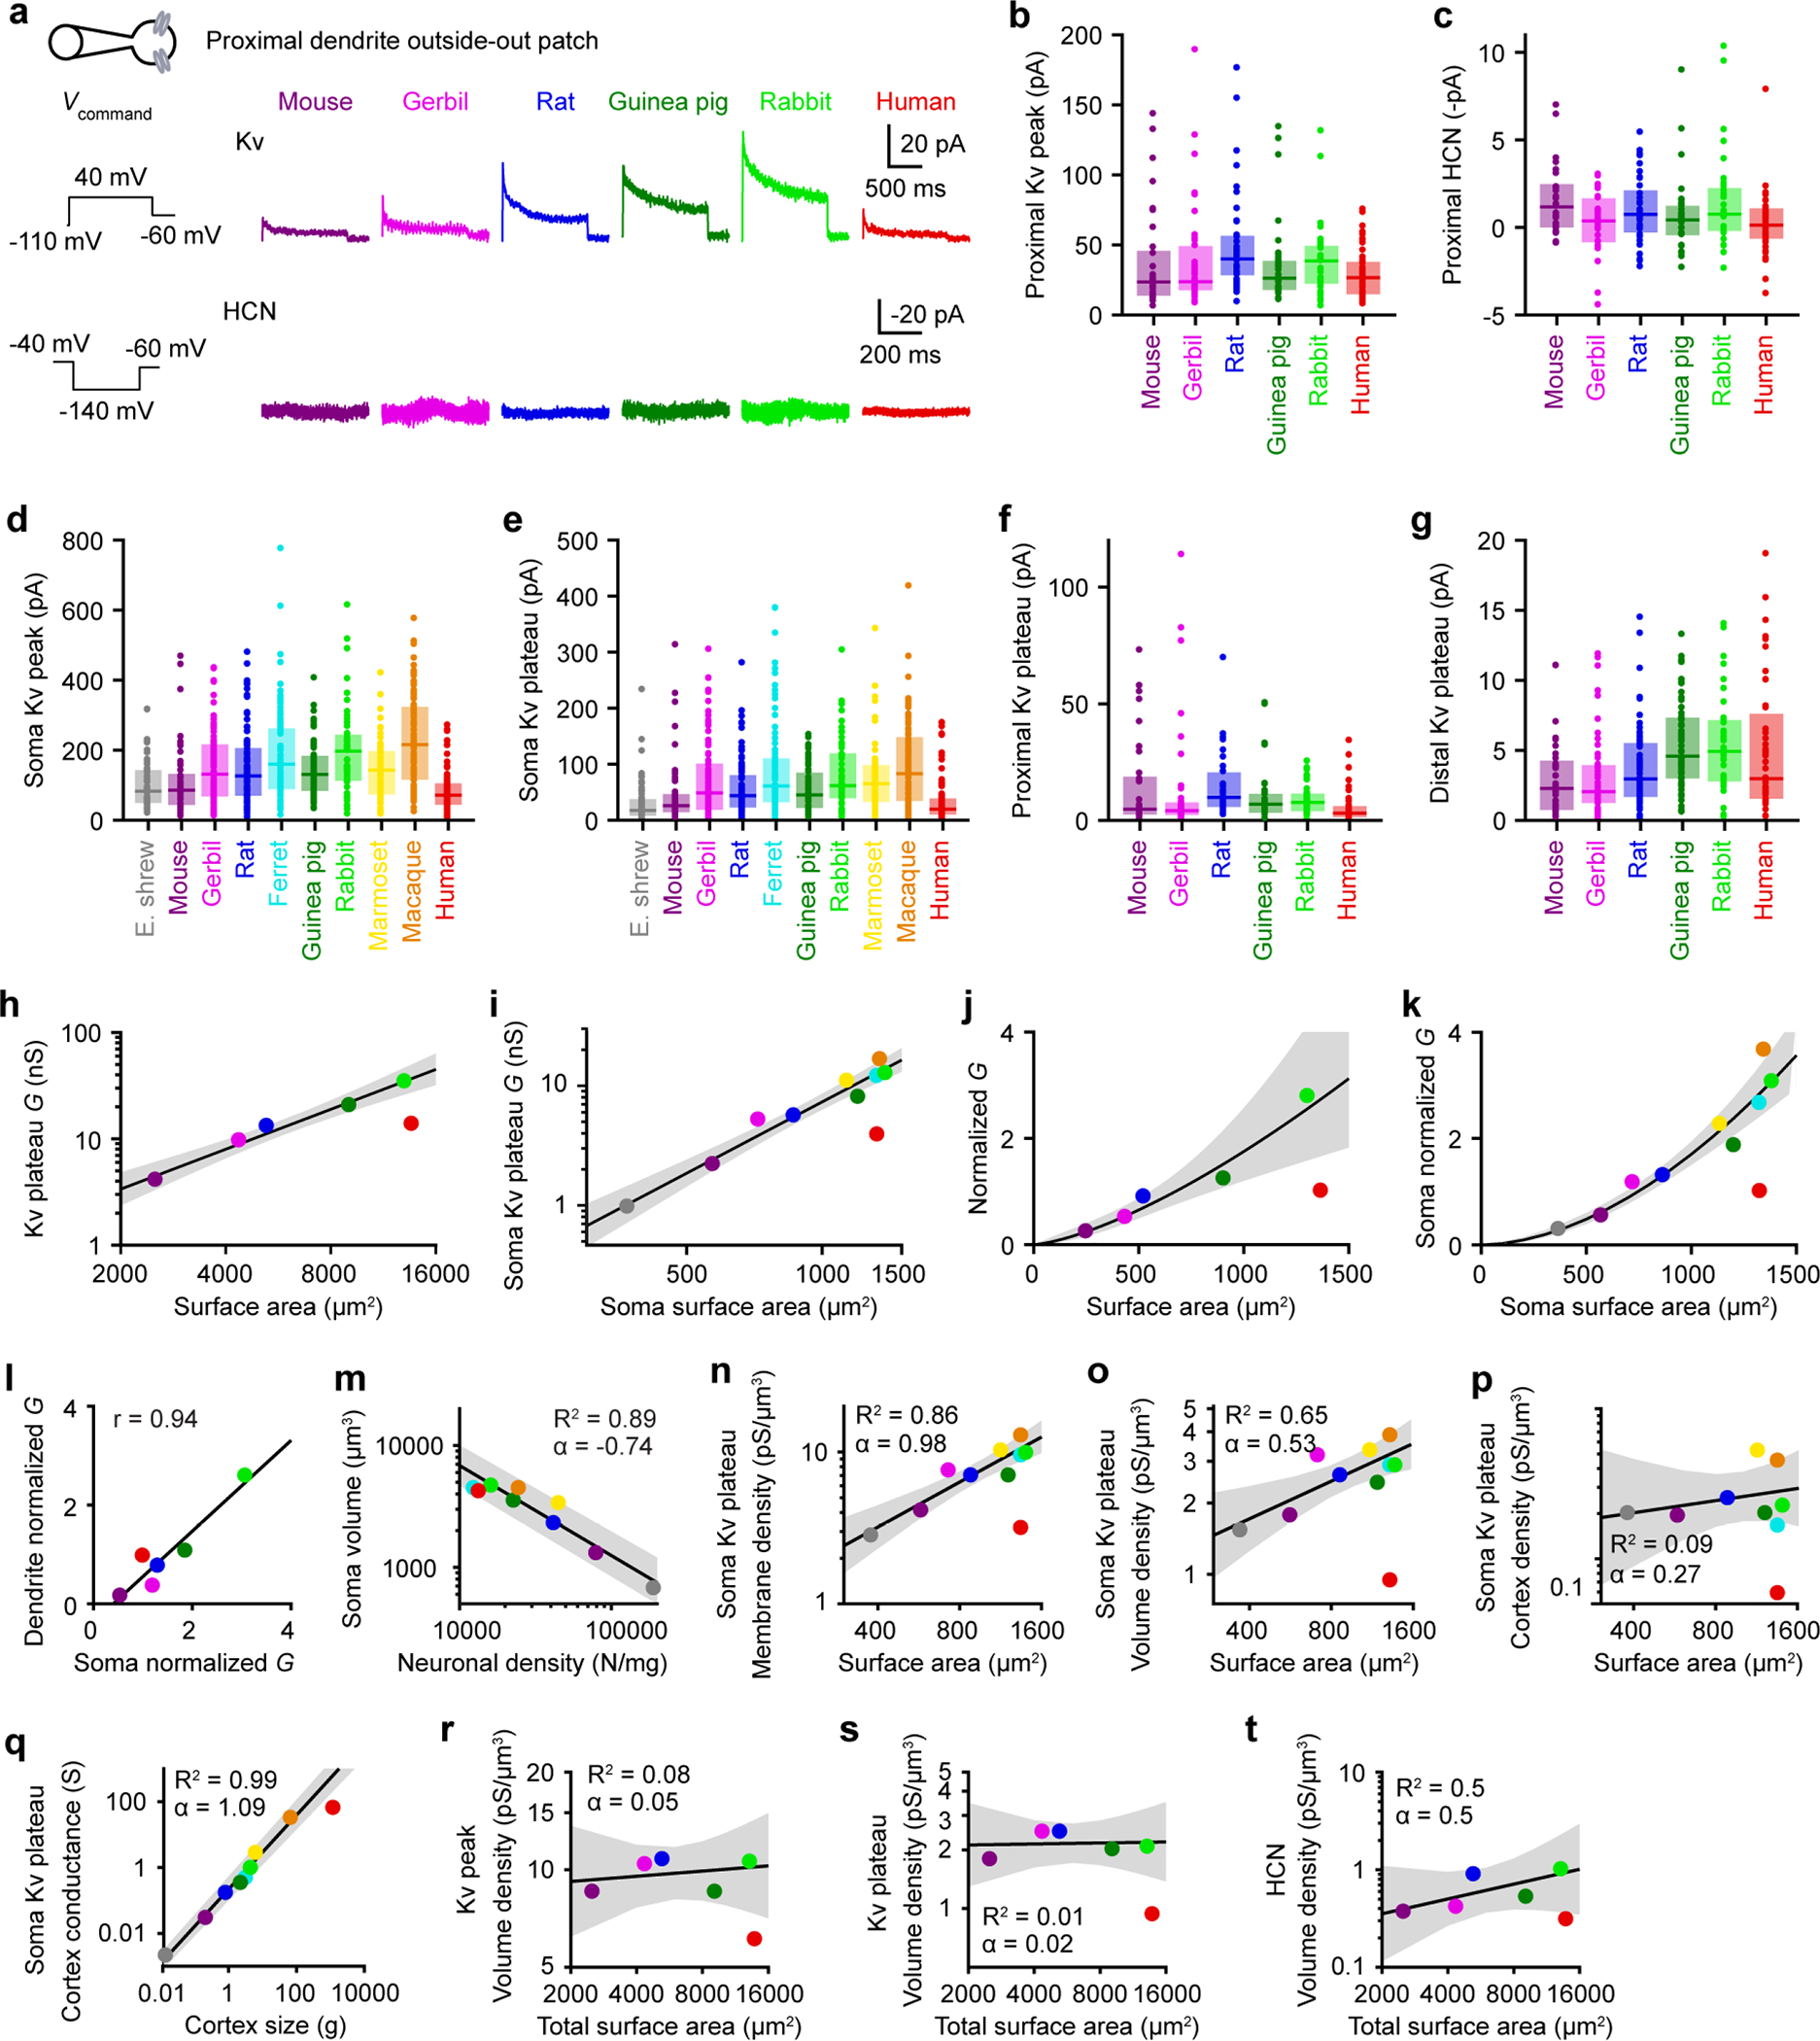
a, Dendritic outside-out patches were pulled from proximal dendrites after obtaining whole-cell recordings. Top, HCN currents with the associated voltage-clamp protocol on the left. Bottom, Kv currents with the associated voltage-clamp protocol on the left.
b-g, Box plots denote the median and 25–75th percentiles.
b, Proximal Kv peak currents (p = 0.010 Kruskal-Wallis, χ2 = 15 & 5 df; mouse n = 32, gerbil n = 38, rat n = 38, guinea pig n = 37, rabbit n = 35, human n = 44).
c, Proximal HCN steady-state currents (p=0.07 Kruskal-Wallis, χ2 = 10 & 5 df; mouse n = 29, gerbil n = 30, rat n = 38, guinea pig n = 30, rabbit n = 31, human n = 42).
d, Somatic Kv peak currents (p < 10−19 Kruskal-Wallis, χ2 = 115 & 9 df; Etruscan shrew n = 59, mouse n = 56, gerbil n = 80, rat n = 80, ferret n = 80, guinea pig n = 70, rabbit n = 53, marmoset n = 63, macaque n = 87, human n = 86).
e, Somatic Kv plateau currents (p < 10−19 Kruskal-Wallis, χ2 = 115 & 9 df; Etruscan shrew n = 59, mouse n = 56, gerbil n = 80, rat n = 80, ferret n = 80, guinea pig n = 70, rabbit n = 53, marmoset n = 63, macaque n = 87, human n = 86).
f, Proximal Kv plateau currents (p < 10−4 Kruskal-Wallis, χ2 = 29 & 5 df; mouse n = 32, gerbil n = 38, rat n = 38, guinea pig n = 26, rabbit n = 35, human n = 44).
g, Distal Kv plateau currents (p =0.00001 Kruskal-Wallis, χ2 = 30 & 5 df; mouse n = 35, gerbil n = 46, rat n = 59, guinea pig n = 58, rabbit n = 39, human n = 43).
h-k, Conductance as a function of neuron size. The lines and shaded error bars represent the fit and 95% confidence interval of an allometric relationship constructed excluding humans.
h, Total Kv plateau conductance on a log-log scale (exponent 1.24 ± 0.09, R2 = 0.983, p < 10−3, linear regression on log-log scale, F = 176 & 3 df, n = 5 for mouse, gerbil, rat, guinea pig, and rabbit).
i, Somatic Kv plateau conductance on a log-log scale (exponent 1.98 ± 0.15, R2 = 0.962, p < 10−5, linear regression on log-log scale, F = 175 & 7 df, n = 9 for shrew, mouse, gerbil, rat, ferret, guinea pig, rabbit, marmoset, and macaque).
j, Normalized average of HCN, Kv peak and Kv plateau conductance (exponent 1.43 ± 0.15, R2 = 0.966, p = 0.003, linear regression on log-log scale, F = 85.7 & 3 df, n = 5 for mouse, gerbil, rat, guinea pig, and rabbit).
k, Normalized average of somatic Kv peak and Kv plateau conductance (exponent 1.82 ± 0.12, R2 = 0.968, p < 10−5, linear regression on log-log scale, F = 212 & 7 df, n = 9 for shrew, mouse, gerbil, rat, ferret, guinea pig, rabbit, marmoset and macaque).
l, Relationship between somatic (normalized average of somatic Kv peak and Kv plateau conductance) and dendritic (normalized average of HCN, Kv peak and Kv plateau conductance) conductance (R2 = 0.891, p = 0.005, linear regression, F = 32.7 & 4 df, n = 6 for mouse, gerbil, rat, guinea pig, rabbit, and human).
m, Soma volume as a function of neuronal density (Extended data table 1) on a log-log scale (exponent −0.74 ± 0.10, R2 = 0.897, p < 10−3, linear regression, F = 52.3 & 6 df, n = 8 for shrew, mouse, rat, ferret, guinea pig, rabbit, marmoset, and macaque). The line and shaded error bars represent the fit and 95% confidence interval of an allometric relationship constructed excluding humans.
n-t, Allometric relationship on a log-log scale. The lines and shaded error bars represent the fit and 95% confidence interval of the relationship constructed excluding humans.
n-o, Somatic Kv plateau conductance densities in volumes as in Figure 4c.
n, Membrane conductance density (exponent 0.98 ± 0.15, R2 = 0.860, p < 10−3, linear regression, F = 43.0 & 7 df, n = 9 for shrew, mouse, gerbil, rat, ferret, guinea pig, rabbit, marmoset, and macaque).
o, Volume Kv peak conductance density where the volume is filled with somas (exponent 0.53 ±0.15, R2 = 0.651, p = 0.009, linear regression, F = 13.1 & 7 df, n = 9 for shrew, mouse, gerbil, rat, ferret, guinea pig, rabbit, marmoset, and macaque).
p-q, Somatic Kv plateau conductance densities in volumes as in Figure 4g. Gerbils were not included because the necessary information was not available in the literature (Extended Data Table 1).
p, Cortex conductance density with accurate neuronal densities (exponent −0.27 ± 0.34, R2 = 0.092, p = 0.47, linear regression, F = 0.61 & 6 df, n = 8 for shrew, mouse, rat, ferret, guinea pig, rabbit, marmoset, and macaque).
q, Total cortex conductance (exponent 1.09 ± 0.06, R2 = 0.985, p < 10−5, linear regression, F = 393 & 6 df, n = 8 for shrew, mouse, rat, ferret, guinea pig, rabbit, marmoset and macaque).
r-t, Same analysis as in Figure 4f, but including dendrites in the volume and conductance calculation.
r, Volume Kv peak conductance density where the volume is filled with somas and dendrites (exponent 0.05 ±0.10, R2 = 0.083, p = 0.64, linear regression, F = 0.272 & 3 df, n = 5 for mouse, gerbil, rat, guinea pig, and rabbit).
s, Volume Kv plateau conductance density where the volume is filled with somas and dendrites (exponent 0.02 ±0.13, R2 = 0.006, p = 0.90, linear regression, F = 0.02 & 3 df, n = 5 for mouse, gerbil, rat, guinea pig, and rabbit).
t, Volume HCN conductance density where the volume is filled with somas and dendrites (exponent 0.5 ±0.29, R2 = 0.500, p = 0.18, linear regression, F = 2.99 & 3 df, n = 5 for mouse, gerbil, rat, guinea pig, and rabbit).
Extended Data Figure 9. Outside-out patch size estimation, related to Figure 3.
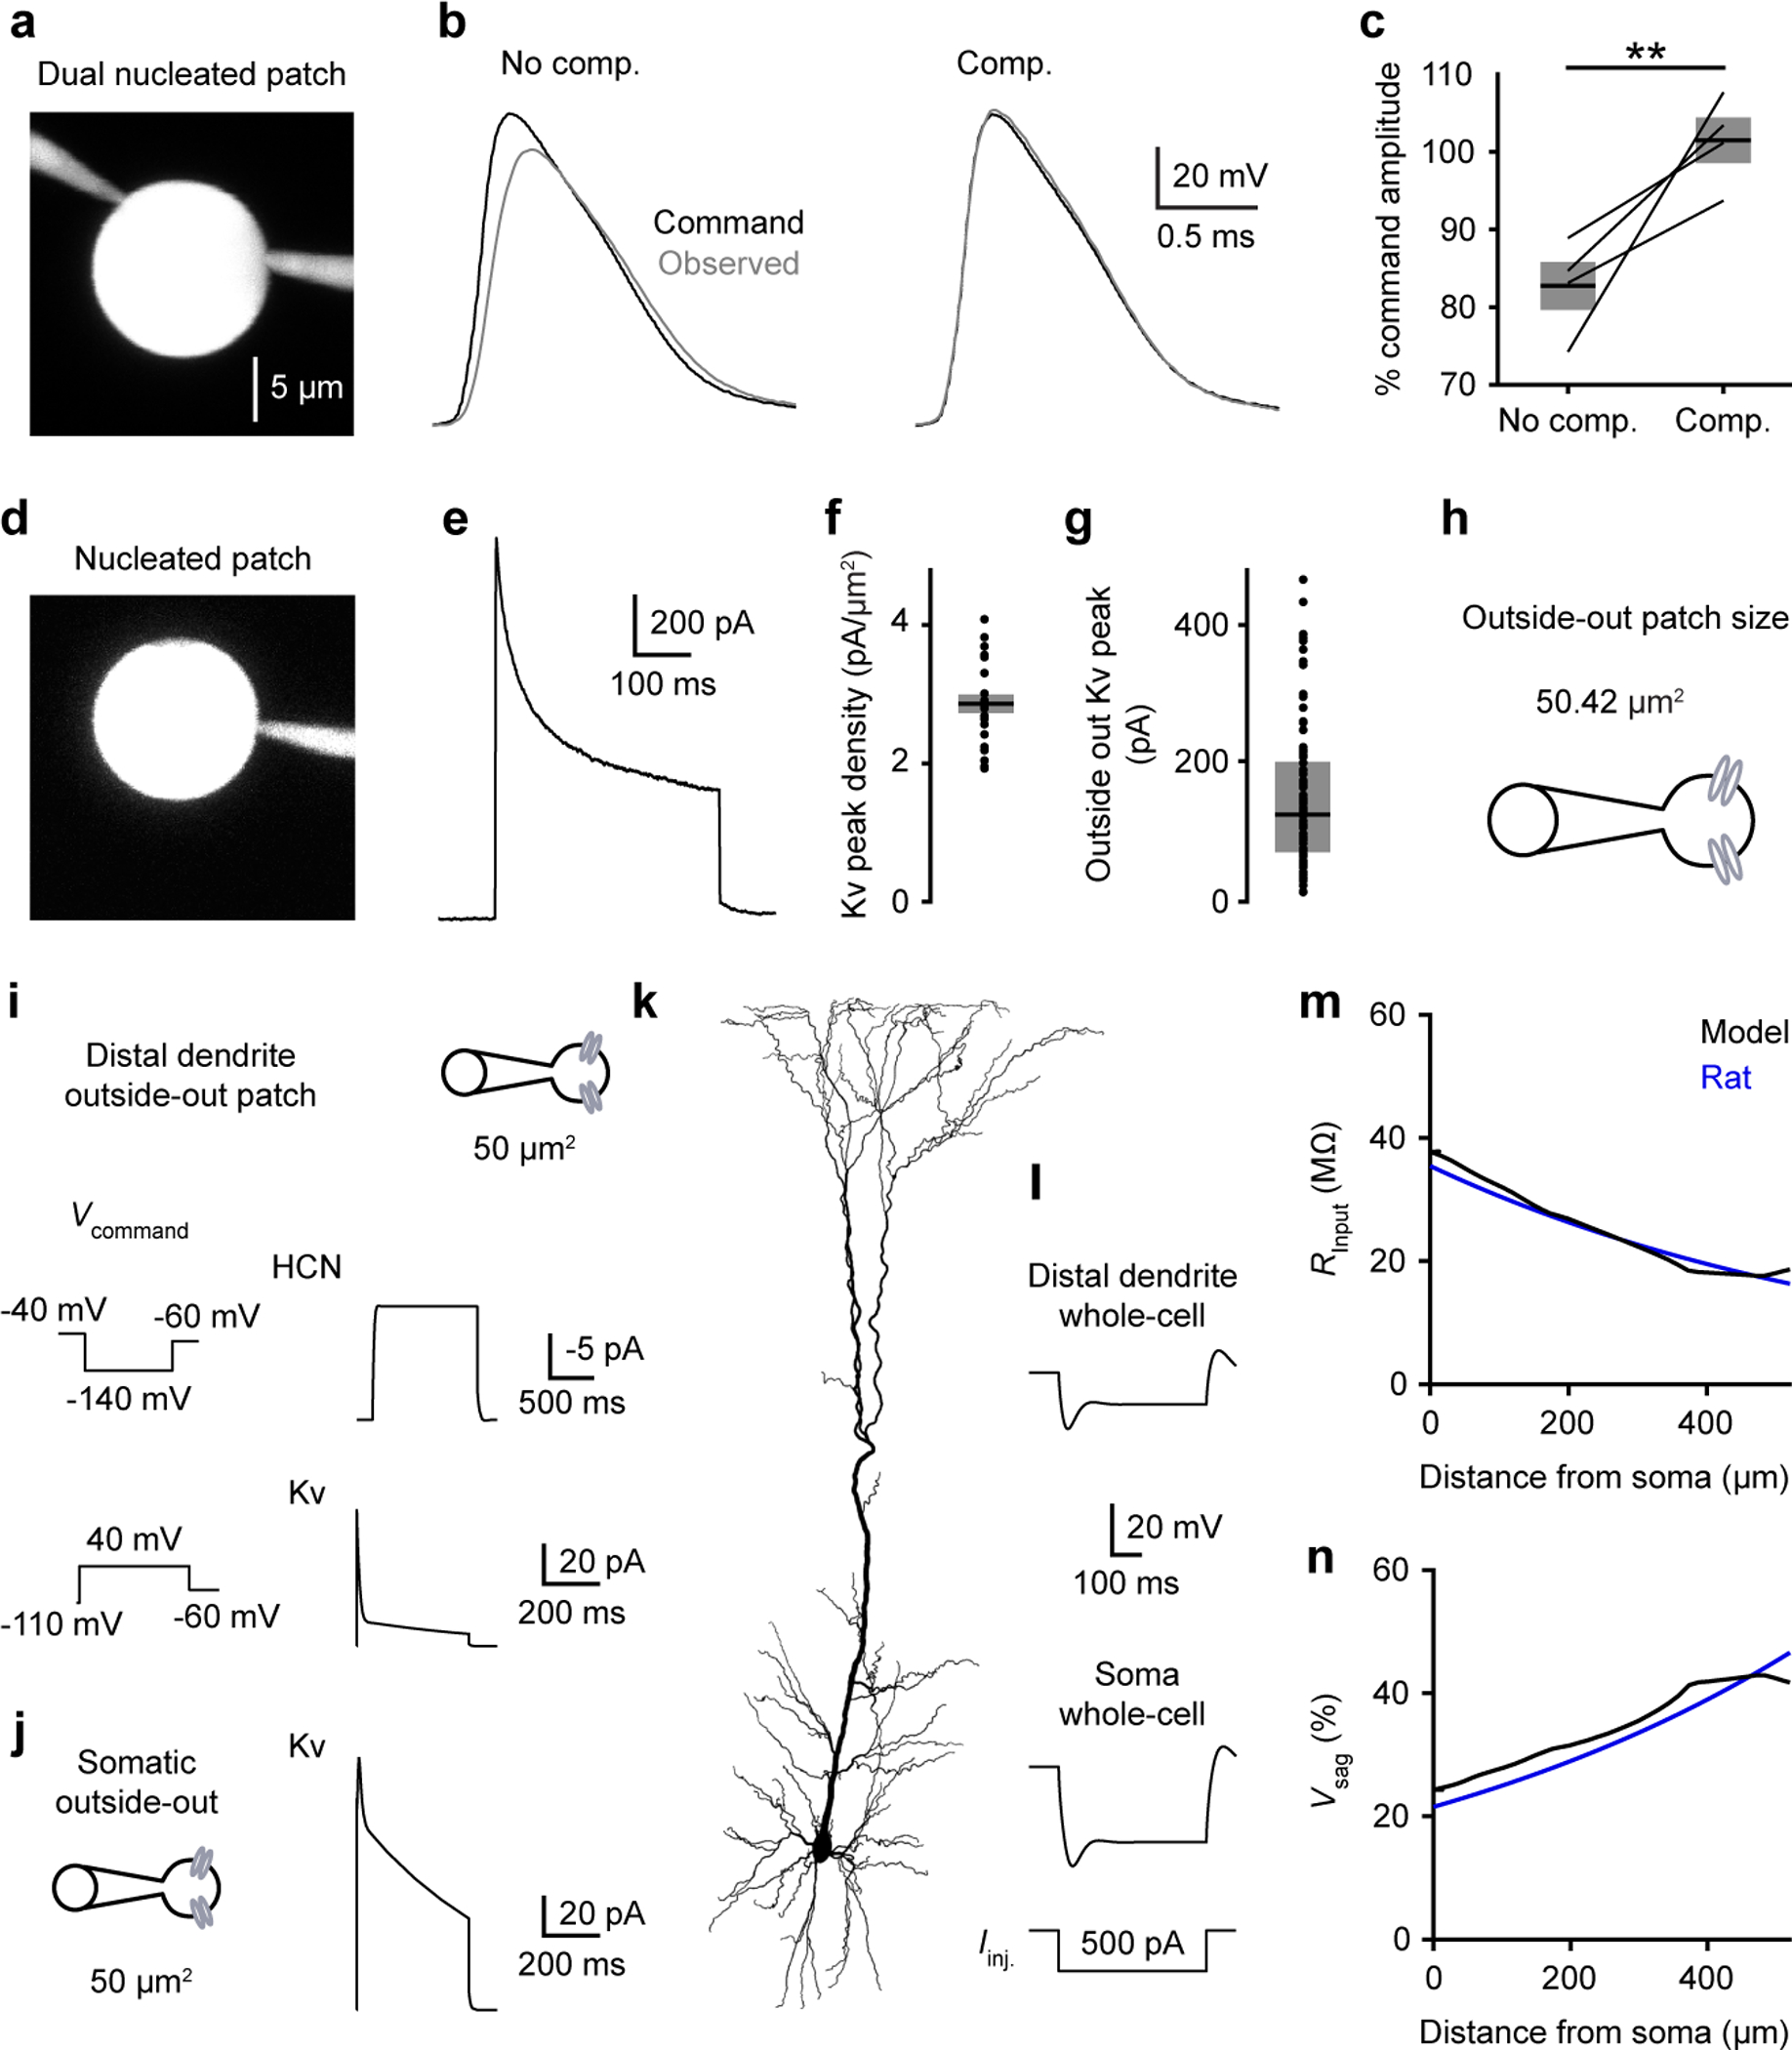
a, Rat dual nucleated patch recordings to test the efficacy of voltage-clamp under nucleated patch configuration.
b, Voltage-clamp command action potential waveform (black) and independently observed waveform (grey) without compensation (left) or with series resistance and whole-cell capacitance predicted and compensated >90% and lag <10 μs (right).
c, Percentage of command waveform amplitude observed with the independent electrode (n = 4; p = 0.0045, two-sided paired t test, t = 4.41 & 6 df). Pooled data represent mean ± SEM.
d, Rat nucleated patch recording with series resistance and whole-cell capacitance predicted and compensated >90% and lag <10 μs.
e, Kv currents from the recording in d.
f, Rat Kv peak current density computed using the Kv currents and patch surface area (n = 22). Pooled data represent mean ± SEM.
g, Rat Kv peak currents in somatic outside-out patch (n = 80). Box plots denote the median and 25–75th percentiles.
h, Outside-out patch surface area computed using the mean Kv peak current density in f and the median Kv peak current in g.
i-j, Recapitulation of outside-out patch recordings in a compartmental model of rat L5 neuron.
i, Model dendritic outside-out patches as spheres of 50 μm2. HCN (top) and Kv (bottom) currents (right) with associated voltage-clamp protocol (left).
j, Model Kv currents in somatic outside-out patches.
k, Morphology used in the model taken from (https://senselab.med.yale.edu/ModelDB/ShowModel?model=124043#tabs-3).
l, Distal dendritic (520 μm from soma) and somatic voltage in response to subthreshold step current injections in the model.
m, Somatic and dendritic input resistance as a function of distance from the soma. Fit to experimental rat data in blue taken from Figure 2d versus model data in black.
n, Somatic and dendritic voltage sag as a function of distance from the soma. Fit to experimental rat data in blue taken from Extended Data Figure 6 versus model data in black.
Extended Data Figure 10. Only human neurons are consistent outliers in electrophysiological features, related to Figure 4.
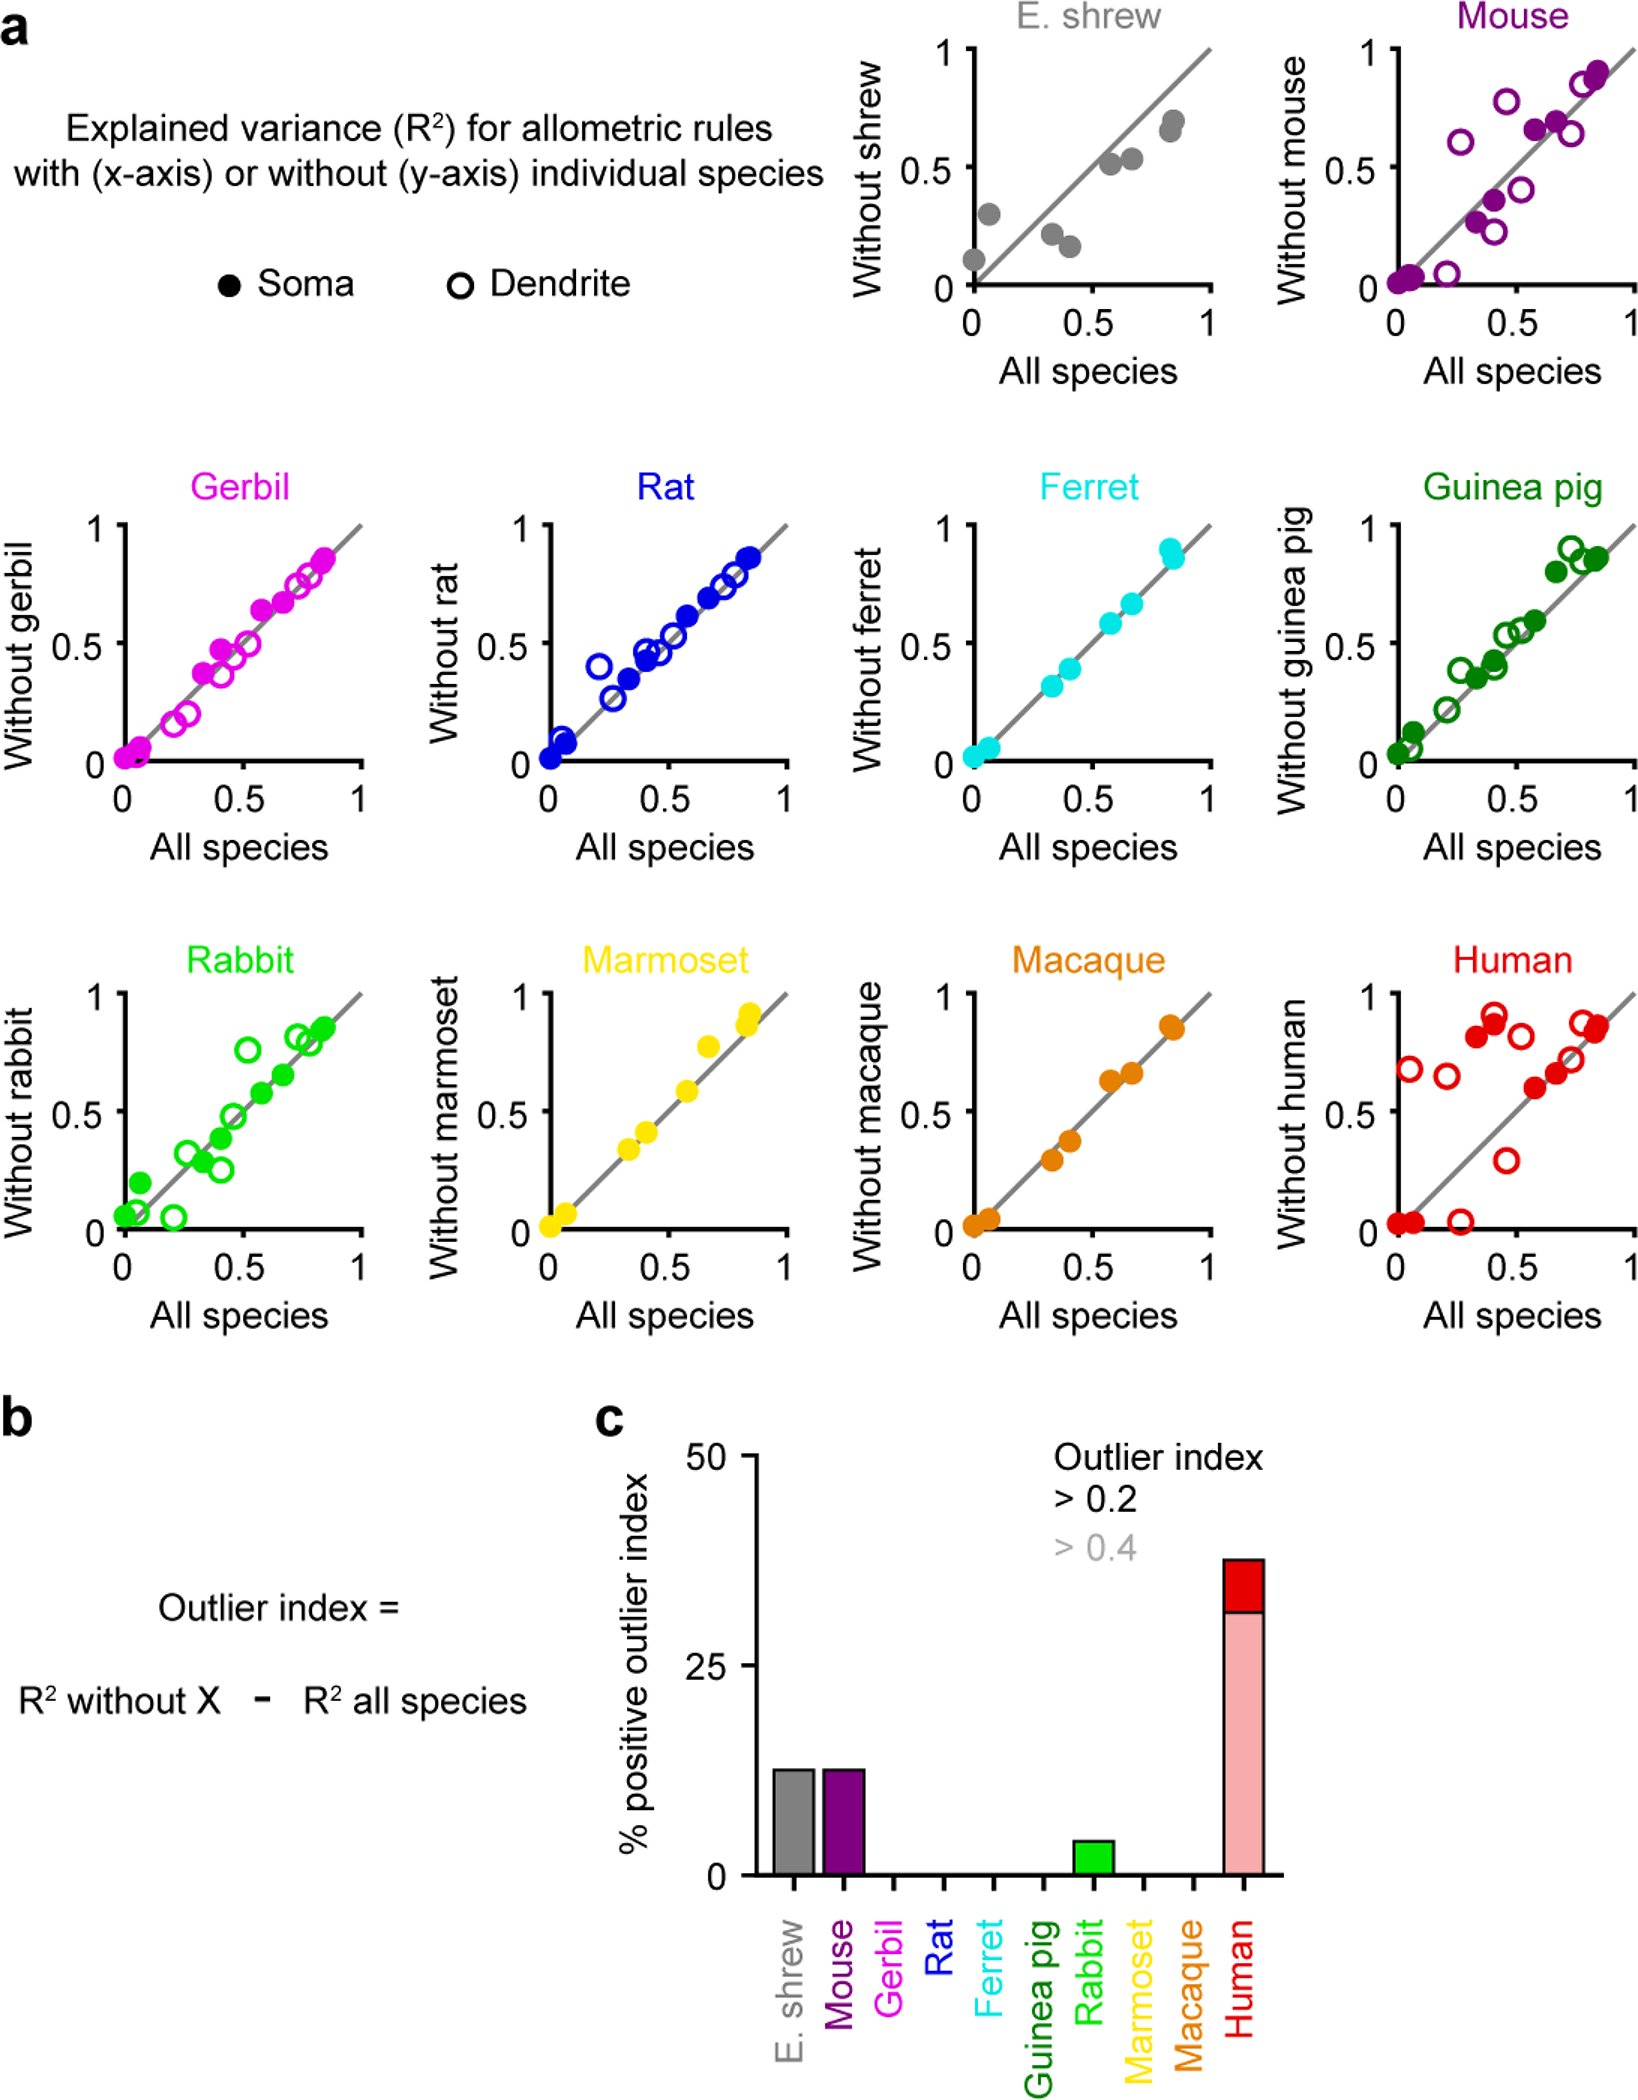
a, Explained variance of allometric relationship with (x-axis) versus without (y-axis) individual species for the same electrophysiological properties as in Figure 4b.
b, Calculation of outlier index. Positive outlier indices reflect cases where a given species is an outlier and does not follow a conserved pattern observed in the other species.
c, Percentage of features with substantial positive outlier indices (threshold at 0.2 or 0.4) for the different species.
Extended data table 1.
Species information.
| Species | Cortex size (g) | Cortical neurons (N) | Cortical neuronal density (N/mg) |
|---|---|---|---|
| Etruscan shrew | 0.01098 | 2,100,000 | 191,229 |
| Mouse | 0.173 | 13,688,162 | 78,672 |
| Gerbil | N/A | N/A | N/A |
| Rat | 0.769 | 31,017,192 | 41,092 |
| Ferret | 3.123 | 38,950,000 | 12,473 |
| Guinea pig | 1.938 | 43,510,525 | 22,508 |
| Rabbit | 4.448 | 71,488,750 | 16,063 |
| Marmoset | 5.561 | 244,720,000 | 44,280 |
| Macaque | 69.832 | 1,710,000,000 | 24,470 |
| Human | 1,232.93 | 16,340,000,000 | 13,520 |
Mouse, rat, guinea pig, rabbit, marmoset, macaque, and human data points were taken directly from Table 1 in this article10. Gerbil data was not available. Ferret data were taken from Table 1. For Etruscan shrews, the cortical volume was found to be 5.3 ± 1.4 mm3 per hemisphere18. The volume was doubled for total cortical volume and converted to mass (0.01098 g) using the brain specific density (1.036 g/cm3)33. Using cortex size and number of cortical neurons3, we calculated neuronal density (191,229 N/mg).
Extended data table 2.
Breakdown of dataset of 2257 recordings from temporal cortex.
| Whole cell | Outside-out | |||
|---|---|---|---|---|
| Soma | Dendrite | Soma | Dendrite | |
| Etruscan shrew | 39 | - | 59 | - |
| Mouse | 85 | 76 | 56 | 67 |
| Gerbil | 58 | 47 | 80 | 84 |
| Rat | 117 (82) | 108 (89) | 80 | 97 (56) |
| Ferret | 31 | - | 80 | - |
| Guinea pig | 47 | 71 | 70 | 95 |
| Rabbit | 40 | 47 | 53 | 74 |
| Marmoset | 41 | - | 63 | - |
| Macaque | 34 | - | 87 | - |
| Human | 126 (39) | 72 (42) | 86 | 87 (34) |
| Total | 618 (121) | 421 (131) | 714 | 504 (90) |
Number of whole-cell and outside-out recordings per species. 342 recordings came from our previously published dataset4 and are shown in the parentheses. There are an additional 170 recordings not included in the 2257 count which come from epileptic rats (Extended Data Figure 11), rat M1 (Extended Data Figure 14), nucleated patches (Extended Data Figure 9), and macaque recordings from L5 of all sizes (Extended Data Figure 14).
Extended data table 3.
Epileptic patient information, related to Methods.
| Sex | Age | Handedness | Age at epilepsy onset | Diagnosis | Seizure frequency | Antiepileptic drugs (pre-surgery) | Brain region |
|---|---|---|---|---|---|---|---|
| M | 26 | R | 21 | Hippocampal Sclerosis and low-grade neuronal lesion | 0.5 – 1 / month | LEV, LTG, CBZ | R ATL |
| M | 37 | R | 1 | Hippocampal Sclerosis | 1–2 / month | LTG, LEV, LCM | L ATL |
| M | 20 | L | 17 | Moderate gliosis of the end folium (CA4) and the pyramidal cell layer (CA1) | 12 / month | LEV, VPA, BZD1 | L ATL |
| M | 32 | R | 29 | Hippocampal Sclerosis | Daily | LCM, LTG | L ATL |
| M | 28 | R | 13 | Hippocampal Sclerosis | 15 / month; at least weekly | LEV, BZD2, OXC | R ATL |
| M | 28 | R | 2 | Hippocampal Sclerosis | 2–3 / month | CLB, LTG | L ATL |
| F | 40 | R | 21 | Hippocampal Sclerosis | 4–5 / month | LEV, LTG, BZD2 | R ATL |
| F | 42 | R | 15 | Hippocampal Sclerosis | 3–4 / month | LEV, LTG | R ATL |
| F | 22 | R | 16 | Hippocampal Sclerosis | ∼12 / month | OXC | R ATL |
| F | 28 | R | 2 | Focal Cortical Dysplasia Type NIB | 1–4 / month | LEV, LCS, ZNS, | R ATL |
| F | 26 | R | 19 | Low grade gial/neuroglial tumour | 1–2 / month | LTG, LEV | R ATL |
| M | 27 | R | 23 | Hippocampal Sclerosis | 4 / month | VPA, CBZ, CLB | R ATL |
| F | 36 | L | 14 | Post traumatic changes and hippocampal sclerosis | 3–8 / month | LTG, ZNS, CLB | L ATL |
| M | 34 | R | 31 | Hippocampal Sclerosis | 0–5 / month | LCS, LEV | R ATL |
| F | 50 | R | 46 | Prior meningioma / pathology = normal | 3–8 / month | ESL, LCS, LEV | R ATL |
| M | 58 | R | 30 | Prior trauma / pathology = focal white matter hypercellularity and focal satellitosis in gray matter | Status 1–2 yearly, aura more frequently | LTG, LCS, LEV | R ATL and orbitofrontal resection. Recordings in R ATL only |
| F | 55 | R | 48 | Likely Mesital temporal sclerosis based on imaging / pathology = inconclusive | 2–5 / month | CLB, LTG, LEV | L ATL |
| M | 48 | L | 18 | Prior trauma but normal pathology | 14 / month | VPA, ESL | R ATL |
| M | 26 | R | 22 | Hippocampal Sclerosis | 3–7 / month | LTG, OXC | L ATL |
| M | 64 | R | 46 | Chronic infarct | 1 every 1–4 mo | VPA, LEV, LCS | R ATL |
| M | 23 | L | 17 | Mild gliosis | ∼6 /year | LEV, LTG, LCS | L ATL |
| M | 52 | R | 47 | Priot trauma with gliosis and organized hematoma | 1 every 1–2 month | LEV, ZNS, PHT | R ATL |
| M | 57 | R | 11 | Hippocampal Sclerosis | 2–6 / year | BRV, LTG, ZNS | R ATL |
| F | 52 | R | 47 | Dysembryoplastic neuroepithelial tumour (DNT), grade 1 | 20 /year | CBZ, LEV | L ATL |
| M | 22 | L | 7 | Hippocampal Sclerosis | 1 / month | LCM | L ATL (modified hemispherectomy) |
Male (M), female (F), left (L), right (R), levetiracetam (LEV), lamotrigine (LTG), carbamazepine (CBZ), lacosamide (LCM), valproic acid (VPA), ativan (BZD1), klonopin (BZD2), oxcarbazepine (OXC), clobazam (CLB), lacosamide (LCS), zonisamide (ZNS), eslicarbazepine (ESL), phenytoin (PHT), brivaracetam (BRV), anterior temporal lobe (ATL).
Acknowledgments
We thank Michael Tadross, Suzana Herculano-Houzel, Michael Tri Do, Amelia Chang, Courtney Yaeger, Valerio Francioni, and Andrew Landau for comments on the manuscript. We thank Michael Brecht for the kind gift of Etruscan Shrews. We thank Jennifer Haupt for veterinary assistance with procedures. We thank Zhanyan Fu, Guoping Feng, Robert Desimone, Mehrdad Jazayeri, Earl Miller, Michal De-Medonsa, Margaret Livingstone, Michael Greenberg, Gabriella Boulting, Amelia Chang, Christopher Walsh, and Ellen DeGennaro for their help with tissue acquisition. We thank James Fox and the division of comparative medicine (DCM) at MIT for expert care and supervision of animals. We thank Brian Coughlin for help with the epileptic rats. We thank Alexandra O’Donnell, Angelique Paulk, and Yangling Chou for assistance in acquiring human tissue.
L.B.L. was supported by the Natural Sciences and Engineering Research Council of Canada (NSERC) [PGSD2–517068-2018] and a Friends of the McGovern Institute fellowship. E.H.S.T. was supported by the National Institute of General Medical Sciences (T32GM007753) and the Paul & Daisy Soros Fellowship. M.T.H. was supported by the Dana Foundation David Mahoney Neuroimaging Grant Program, the NIH (RO1NS106031), and the Harvard-MIT Joint Research Grants Program in Basic Neuroscience. M.T.H is a Klingenstein-Simons Fellow, Vallee Foundation Scholar, and a McKnight Scholar.
Footnotes
Competing Interest
The authors declare no competing financial interests.
Additional information
Reprints and permissions information is available at www.nature.com/reprints.
Data Availability
All data generated and supporting the findings of this study are presented in the paper. Additional information will be made available upon reasonable request.
Main Text References
- 1.Elston GN, Benavides-Piccione R & DeFelipe J The pyramidal cell in cognition: a comparative study in human and monkey. The Journal of neuroscience : the official Journal of the Society for Neuroscience 21, Rc163, doi: 10.1523/JNEUROSCI.21-17-j0002.2001 (2001). [DOI] [PMC free article] [PubMed] [Google Scholar]
- 2.Mohan H et al. Dendritic and Axonal Architecture of Individual Pyramidal Neurons across Layers of Adult Human Neocortex. Cerebral cortex (New York, N.Y.: 1991) 25, 4839–4853, doi: 10.1093/cercor/bhv188 (2015). [DOI] [PMC free article] [PubMed] [Google Scholar]
- 3.Jacobs B et al. Comparative morphology of gigantopyramidal neurons in primary motor cortex across mammals. The Journal of comparative neurology 526, 496–536, doi: 10.1002/cne.24349 (2018). [DOI] [PubMed] [Google Scholar]
- 4.Beaulieu-Laroche L et al. Enhanced Dendritic Compartmentalization in Human Cortical Neurons. Cell 175, 643–651.e614, doi: 10.1016/j.cell.2018.08.045 (2018). [DOI] [PMC free article] [PubMed] [Google Scholar]
- 5.Gidon A et al. Dendritic action potentials and computation in human layer 2/3 cortical neurons. Science (New York, N.Y.) 367, 83–87, doi: 10.1126/science.aax6239 (2020). [DOI] [PubMed] [Google Scholar]
- 6.Kalmbach BE et al. h-Channels Contribute to Divergent Intrinsic Membrane Properties of Supragranular Pyramidal Neurons in Human versus Mouse Cerebral Cortex. Neuron 100, 1194–1208.e1195, doi: 10.1016/j.neuron.2018.10.012 (2018). [DOI] [PMC free article] [PubMed] [Google Scholar]
- 7.Verhoog MB et al. Mechanisms underlying the rules for associative plasticity at adult human neocortical synapses. The Journal of neuroscience : the official journal of the Society for Neuroscience 33, 17197–17208, doi: 10.1523/jneurosci.3158-13.2013 (2013). [DOI] [PMC free article] [PubMed] [Google Scholar]
- 8.Hattox AM & Nelson SB Layer V neurons in mouse cortex projecting to different targets have distinct physiological properties. Journal of neurophysiology 98, 3330–3340, doi: 10.1152/jn.00397.2007 (2007). [DOI] [PubMed] [Google Scholar]
- 9.Dembrow NC, Chitwood RA & Johnston D Projection-specific neuromodulation of medial prefrontal cortex neurons. The Journal of neuroscience : the official journal of the Society for Neuroscience 30, 16922–16937, doi: 10.1523/jneurosci.3644-10.2010 (2010). [DOI] [PMC free article] [PubMed] [Google Scholar]
- 10.Herculano-Houzel S, Catania K, Manger PR & Kaas JH Mammalian Brains Are Made of These: A Dataset of the Numbers and Densities of Neuronal and Nonneuronal Cells in the Brain of Glires, Primates, Scandentia, Eulipotyphlans, Afrotherians and Artiodactyls, and Their Relationship with Body Mass. Brain, behavior and evolution 86, 145–163, doi: 10.1159/000437413 (2015). [DOI] [PubMed] [Google Scholar]
- 11.Spruston N Pyramidal neurons: dendritic structure and synaptic integration. Nature reviews. Neuroscience 9, 206–221, doi: 10.1038/nrn2286 (2008). [DOI] [PubMed] [Google Scholar]
- 12.Larkum ME, Zhu JJ & Sakmann B Dendritic mechanisms underlying the coupling of the dendritic with the axonal action potential initiation zone of adult rat layer 5 pyramidal neurons. The Journal of physiology 533, 447–466, doi: 10.1111/j.1469-7793.2001.0447a.x (2001). [DOI] [PMC free article] [PubMed] [Google Scholar]
- 13.Harnett MT, Xu NL, Magee JC & Williams SR Potassium channels control the interaction between active dendritic integration compartments in layer 5 cortical pyramidal neurons. Neuron 79, 516–529, doi: 10.1016/j.neuron.2013.06.005 (2013). [DOI] [PMC free article] [PubMed] [Google Scholar]
- 14.Mainen ZF & Sejnowski TJ Influence of dendritic structure on firing pattern in model neocortical neurons. Nature 382, 363, doi: 10.1038/382363a0 (1996). [DOI] [PubMed] [Google Scholar]
- 15.Harnett MT, Magee JC & Williams SR Distribution and function of HCN channels in the apical dendritic tuft of neocortical pyramidal neurons. The Journal of neuroscience : the official journal of the Society for Neuroscience 35, 1024–1037, doi: 10.1523/jneurosci.2813-14.2015 (2015). [DOI] [PMC free article] [PubMed] [Google Scholar]
- 16.Kole MH, Hallermann S & Stuart GJ Single Ih channels in pyramidal neuron dendrites: properties, distribution, and impact on action potential output. The Journal of neuroscience : the official journal of the Society for Neuroscience 26, 1677–1687, doi: 10.1523/jneurosci.3664-05.2006 (2006). [DOI] [PMC free article] [PubMed] [Google Scholar]
- 17.Vigneswaran G, Kraskov A & Lemon RN Large Identified Pyramidal Cells in Macaque Motor and Premotor Cortex Exhibit “Thin Spikes”: Implications for Cell Type Classification. The Journal of Neuroscience 31, 14235–14242, doi: 10.1523/jneurosci.3142-11.2011 (2011). [DOI] [PMC free article] [PubMed] [Google Scholar]
Methods References
- 18.Naumann RK, Anjum F, Roth-Alpermann C & Brecht M Cytoarchitecture, areas, and neuron numbers of the Etruscan shrew cortex. The Journal of comparative neurology 520, 2512–2530, doi: 10.1002/cne.23053 (2012). [DOI] [PubMed] [Google Scholar]
- 19.Paxinos G & Watson C The Rat Brain in Stereotaxic Coordinates 7th Edition. 472 (Academic Press, 2013). [Google Scholar]
- 20.Hutchinson EB et al. Population based MRI and DTI templates of the adult ferret brain and tools for voxelwise analysis. NeuroImage 152, 575–589, doi: 10.1016/j.neuroimage.2017.03.009 (2017). [DOI] [PMC free article] [PubMed] [Google Scholar]
- 21.Muñoz-Moreno E et al. A magnetic resonance image based atlas of the rabbit brain for automatic parcellation. PLoS One 8, e67418–e67418, doi: 10.1371/journal.pone.0067418 (2013). [DOI] [PMC free article] [PubMed] [Google Scholar]
- 22.Yuasa S, Nakamura K & Kohsaka S Stereotaxic Atlas of the Marmoset Brain. (National Institute of Neuroscience (JP), 2010). [Google Scholar]
- 23.Paxinos G, Petrides M & Evrard H The Rhesus Monkey Brain in Stereotaxic Coordinates 4th Edition. (Elsevier, 2021). [Google Scholar]
- 24.Bekkers JM Properties of voltage-gated potassium currents in nucleated patches from large layer 5 cortical pyramidal neurons of the rat. The Journal of physiology 525 Pt 3, 593–609, doi: 10.1111/j.1469-7793.2000.t01-1-00593.x (2000). [DOI] [PMC free article] [PubMed] [Google Scholar]
- 25.Ramaswamy S & Markram H Anatomy and physiology of the thick-tufted layer 5 pyramidal neuron. Frontiers in cellular neuroscience 9, 233, doi: 10.3389/fncel.2015.00233 (2015). [DOI] [PMC free article] [PubMed] [Google Scholar]
- 26.Hay E, Hill S, Schurmann F, Markram H & Segev I Models of neocortical layer 5b pyramidal cells capturing a wide range of dendritic and perisomatic active properties. PLoS computational biology 7, e1002107, doi: 10.1371/journal.pcbi.1002107 (2011). [DOI] [PMC free article] [PubMed] [Google Scholar]
- 27.Hodge RD et al. Conserved cell types with divergent features in human versus mouse cortex. Nature 573, 61–68, doi: 10.1038/s41586-019-1506-7 (2019). [DOI] [PMC free article] [PubMed] [Google Scholar]
- 28.Carnevale NT & Hines ML The NEURON Book. (Cambridge University Press, 2006). [Google Scholar]
- 29.Larkum ME, Nevian T, Sandler M, Polsky A & Schiller J Synaptic integration in tuft dendrites of layer 5 pyramidal neurons: a new unifying principle. Science (New York, N.Y.) 325, 756–760, doi: 10.1126/science.1171958 (2009). [DOI] [PubMed] [Google Scholar]
- 30.Miller DJ, Balaram P, Young NA & Kaas JH Three counting methods agree on cell and neuron number in chimpanzee primary visual cortex. Front Neuroanat 8, doi: 10.3389/fnana.2014.00036 (2014). [DOI] [PMC free article] [PubMed] [Google Scholar]
- 31.Pilati N, Barker M, Panteleimonitis S, Donga R & Hamann M A rapid method combining Golgi and Nissl staining to study neuronal morphology and cytoarchitecture. The journal of histochemistry and cytochemistry: official journal of the Histochemistry Society 56, 539–550, doi: 10.1369/jhc.2008.950246 (2008). [DOI] [PMC free article] [PubMed] [Google Scholar]
- 32.Engel D & Jonas P Presynaptic action potential amplification by voltage-gated Na+ channels in hippocampal mossy fiber boutons. Neuron 45, 405–417, doi: 10.1016/j.neuron.2004.12.048 (2005). [DOI] [PubMed] [Google Scholar]
- 33.Herculano-Houzel S The Human Advantage: A New Understanding of How Our Brain Became Remarkable. (MIT Press, 2016). [Google Scholar]
- 34.Jardim-Messeder D et al. Dogs Have the Most Neurons, Though Not the Largest Brain: Trade-Off between Body Mass and Number of Neurons in the Cerebral Cortex of Large Carnivoran Species. Front Neuroanat 11, 118, doi: 10.3389/fnana.2017.00118 (2017). [DOI] [PMC free article] [PubMed] [Google Scholar]
Associated Data
This section collects any data citations, data availability statements, or supplementary materials included in this article.
Data Availability Statement
All data generated and supporting the findings of this study are presented in the paper. Additional information will be made available upon reasonable request.


