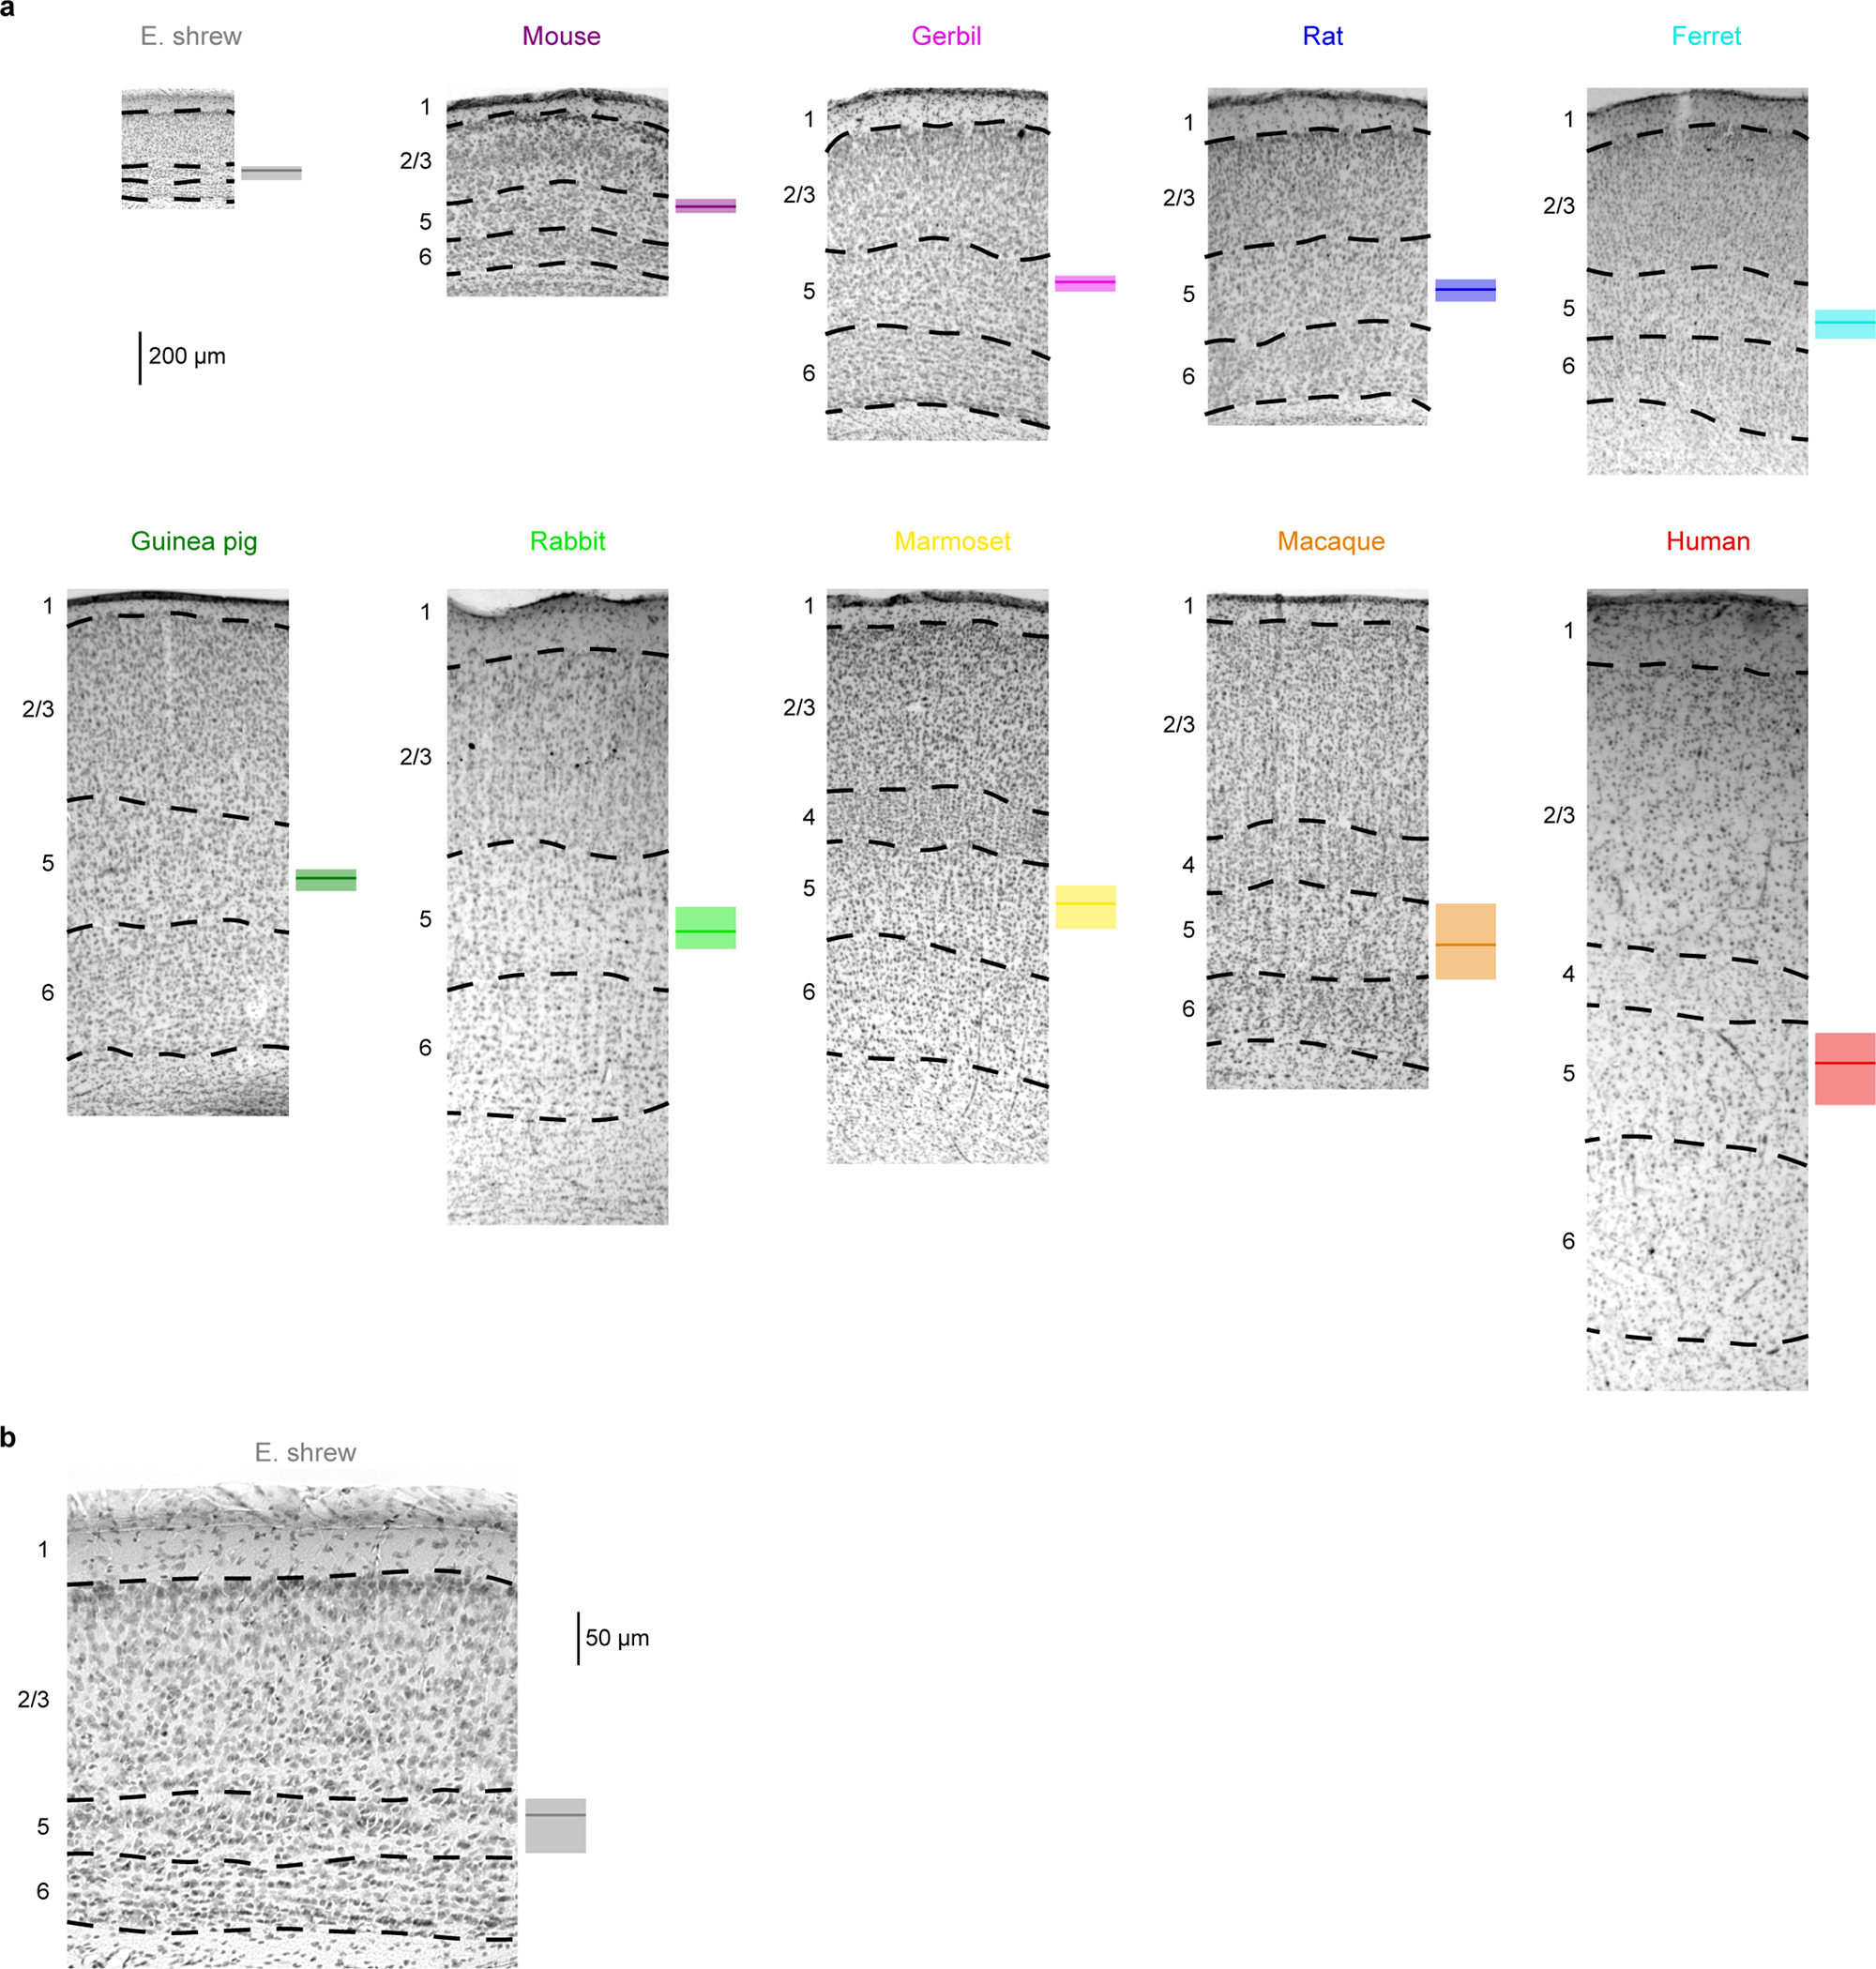
Extended Data Figure 1. Histological identification of cortical layers, related to Figure 1.

a, Nissl-stained brain slices from the 10 species with labeled cortical layers. Box plots on the right of individual slices denote the median and 25–75th percentiles of somatic depth for electrophysiological recordings (Etruscan shrew n = 39, mouse n = 162, gerbil n = 105, rat n = 215, ferret n = 31, guinea pig n = 118, rabbit n = 87, marmoset n = 41, macaque n = 34, human n = 208).
b, The shrew slice from a, expanded to show detail (n = 39).
