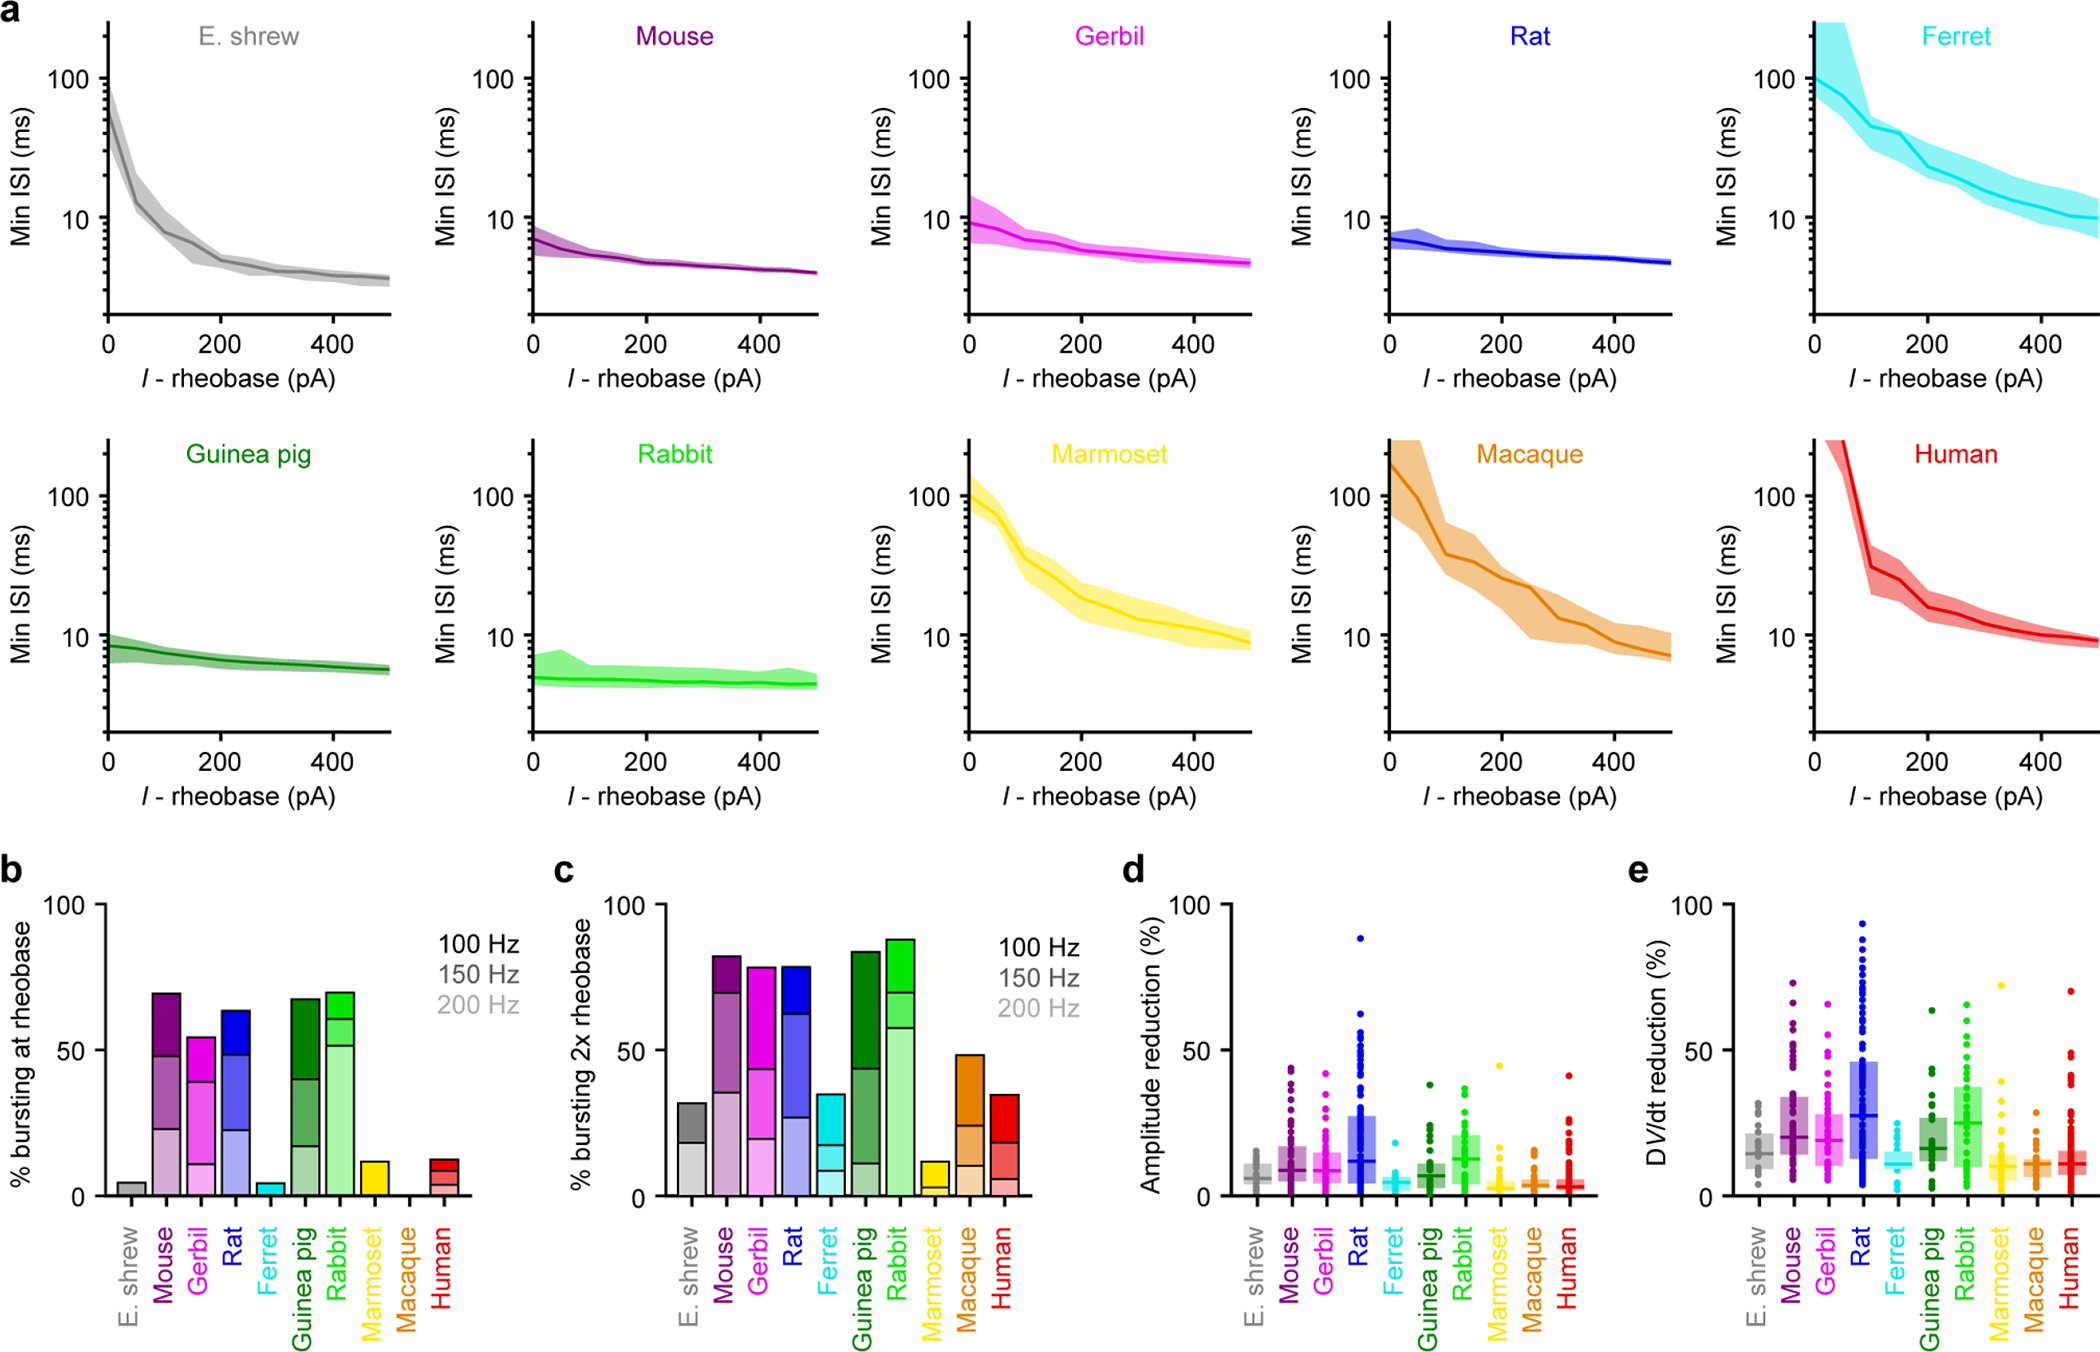
Extended Data Figure 4. Somatic bursting properties, related to Figure 1.

Somatic bursting properties (Etruscan shrew n = 22, mouse n = 59, gerbil n = 46, rat n = 93, ferret n = 23, guinea pig n = 30, rabbit n = 33, marmoset n = 34, macaque n = 29, human n = 104).
a, Minimum instantaneous interspike interval (ISI) on a log scale as a function of injected current above rheobase. The lines and shaded error bars represent population medians and 95% confidence intervals.
b, Percentage of neurons exhibiting bursts with different frequency thresholds at rheobase.
c, Same as b but at double the rheobase.
d-e, Box plots denote the median and 25–75th percentiles.
d, Maximal action potential amplitude reduction (p < 10−18 Kruskal-Wallis, χ 2 = 107 & 9 df).
e, Maximal action potential d Wdt reduction (p < 10−15 Kruskal-Wallis, χ 2 = 95 & 9 df).
