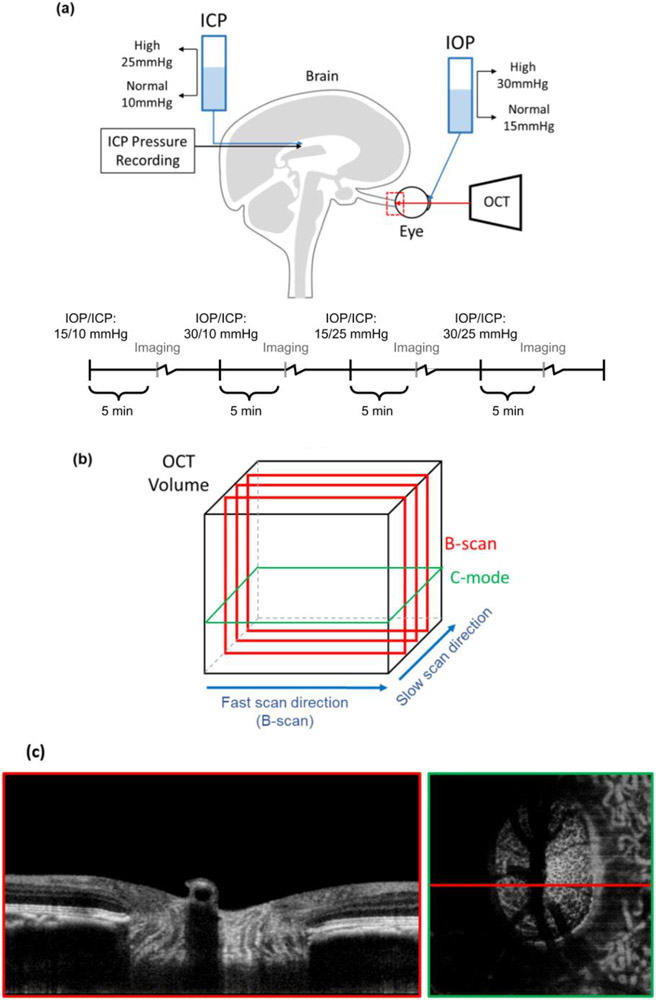
Figure 1:
(a) Diagram of in vivo experimental set up and timeline, in which both intraocular and intracranial pressures were controlled via gravity perfusion while the optic nerve head region (red) was imaged with optical coherence tomography. This study focuses on analysis of the four IOP/ICP conditions highlighted. The experimental protocol included other IOP/ICP conditions between the ones highlighted. See the main text for details. Motion artifacts in the slow scan direction were removed (b). Example B-scan and C-mode views at the lamina cribrosa level acquired with an IOP of 15 mmHg and ICP of 8 mmHg (c).

