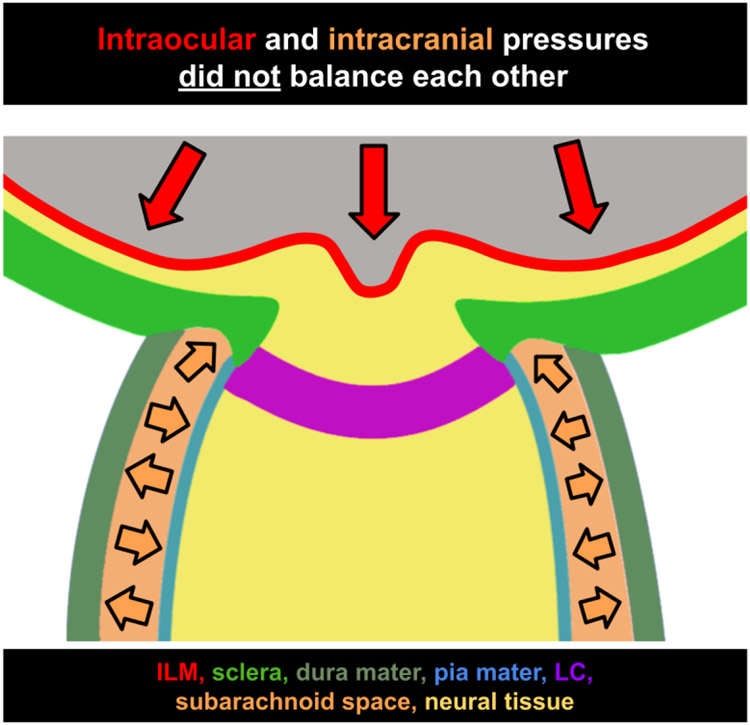
Figure 10:
Intraocular and intracranial pressures do not balance each other. Diagram of the ONH with representations of the inner limiting membrane (ILM, red), sclera (green), dura mater (gray-green), pia mater (blue), lamina cribrosa (LC, purple), subarachnoid space (orange), and neural tissue (yellow). Direction of force placed by intraocular pressure (red arrows) and intracranial pressure (orange arrows.)

