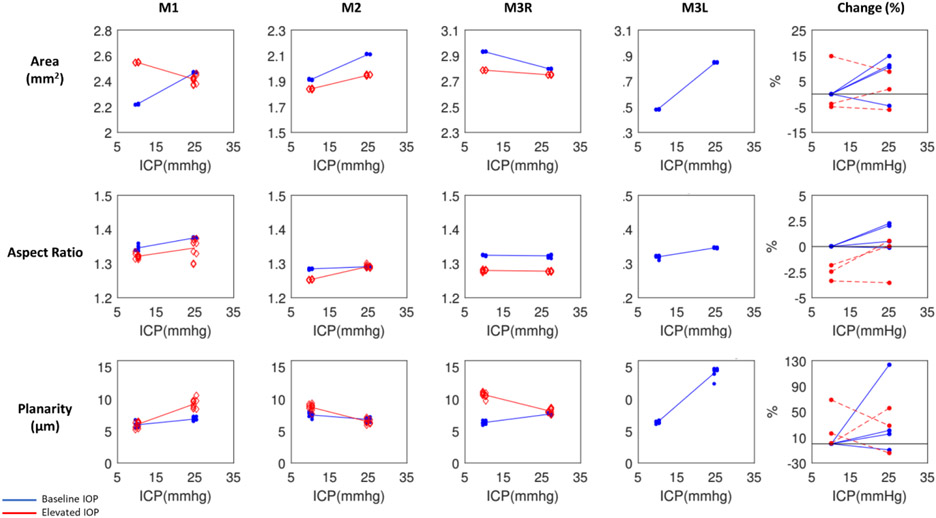
Figure 6:
Scleral canal displacements due to variations in intraocular (IOP) and intracranial (ICP) pressures. Percentage changes of BMO area, aspect ratio, and planarity with respect to baseline values due to ICP elevation at baseline IOP (blue) and elevated IOP (red). Each line represents the regression of the estimates, or average of 10 bootstrap sampling points, at each ICP. To reduce overlap, the symbols were scattered laterally slightly.

