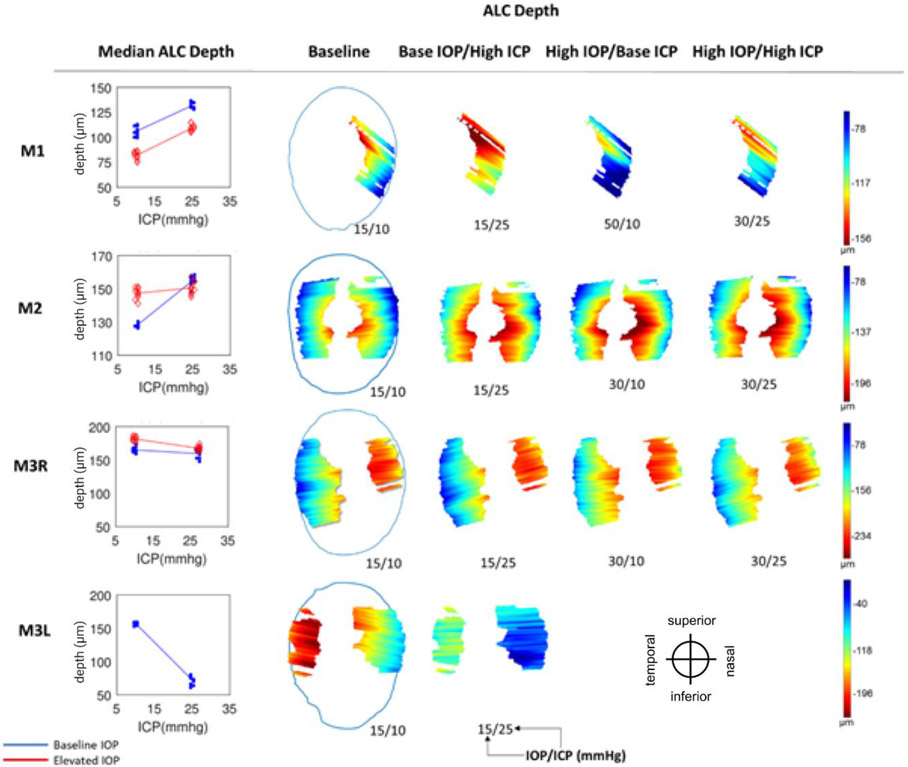
Figure 8:
Anterior lamina cribrosa (ALC) depth. (Left) Median ALC depth at baseline IOP (blue) and elevated IOP (red). Each line represents the regression of the estimates, or average of 10 bootstrap sampling points, at each ICP. (Right) Heat maps of ALC depth (blue to red: shallower to deeper) with respect to scleral canal (blue outline), shown only on regions visible across all 4 pressure conditions within an eye. Pressures for each condition are indicated as IOP/ICP.

