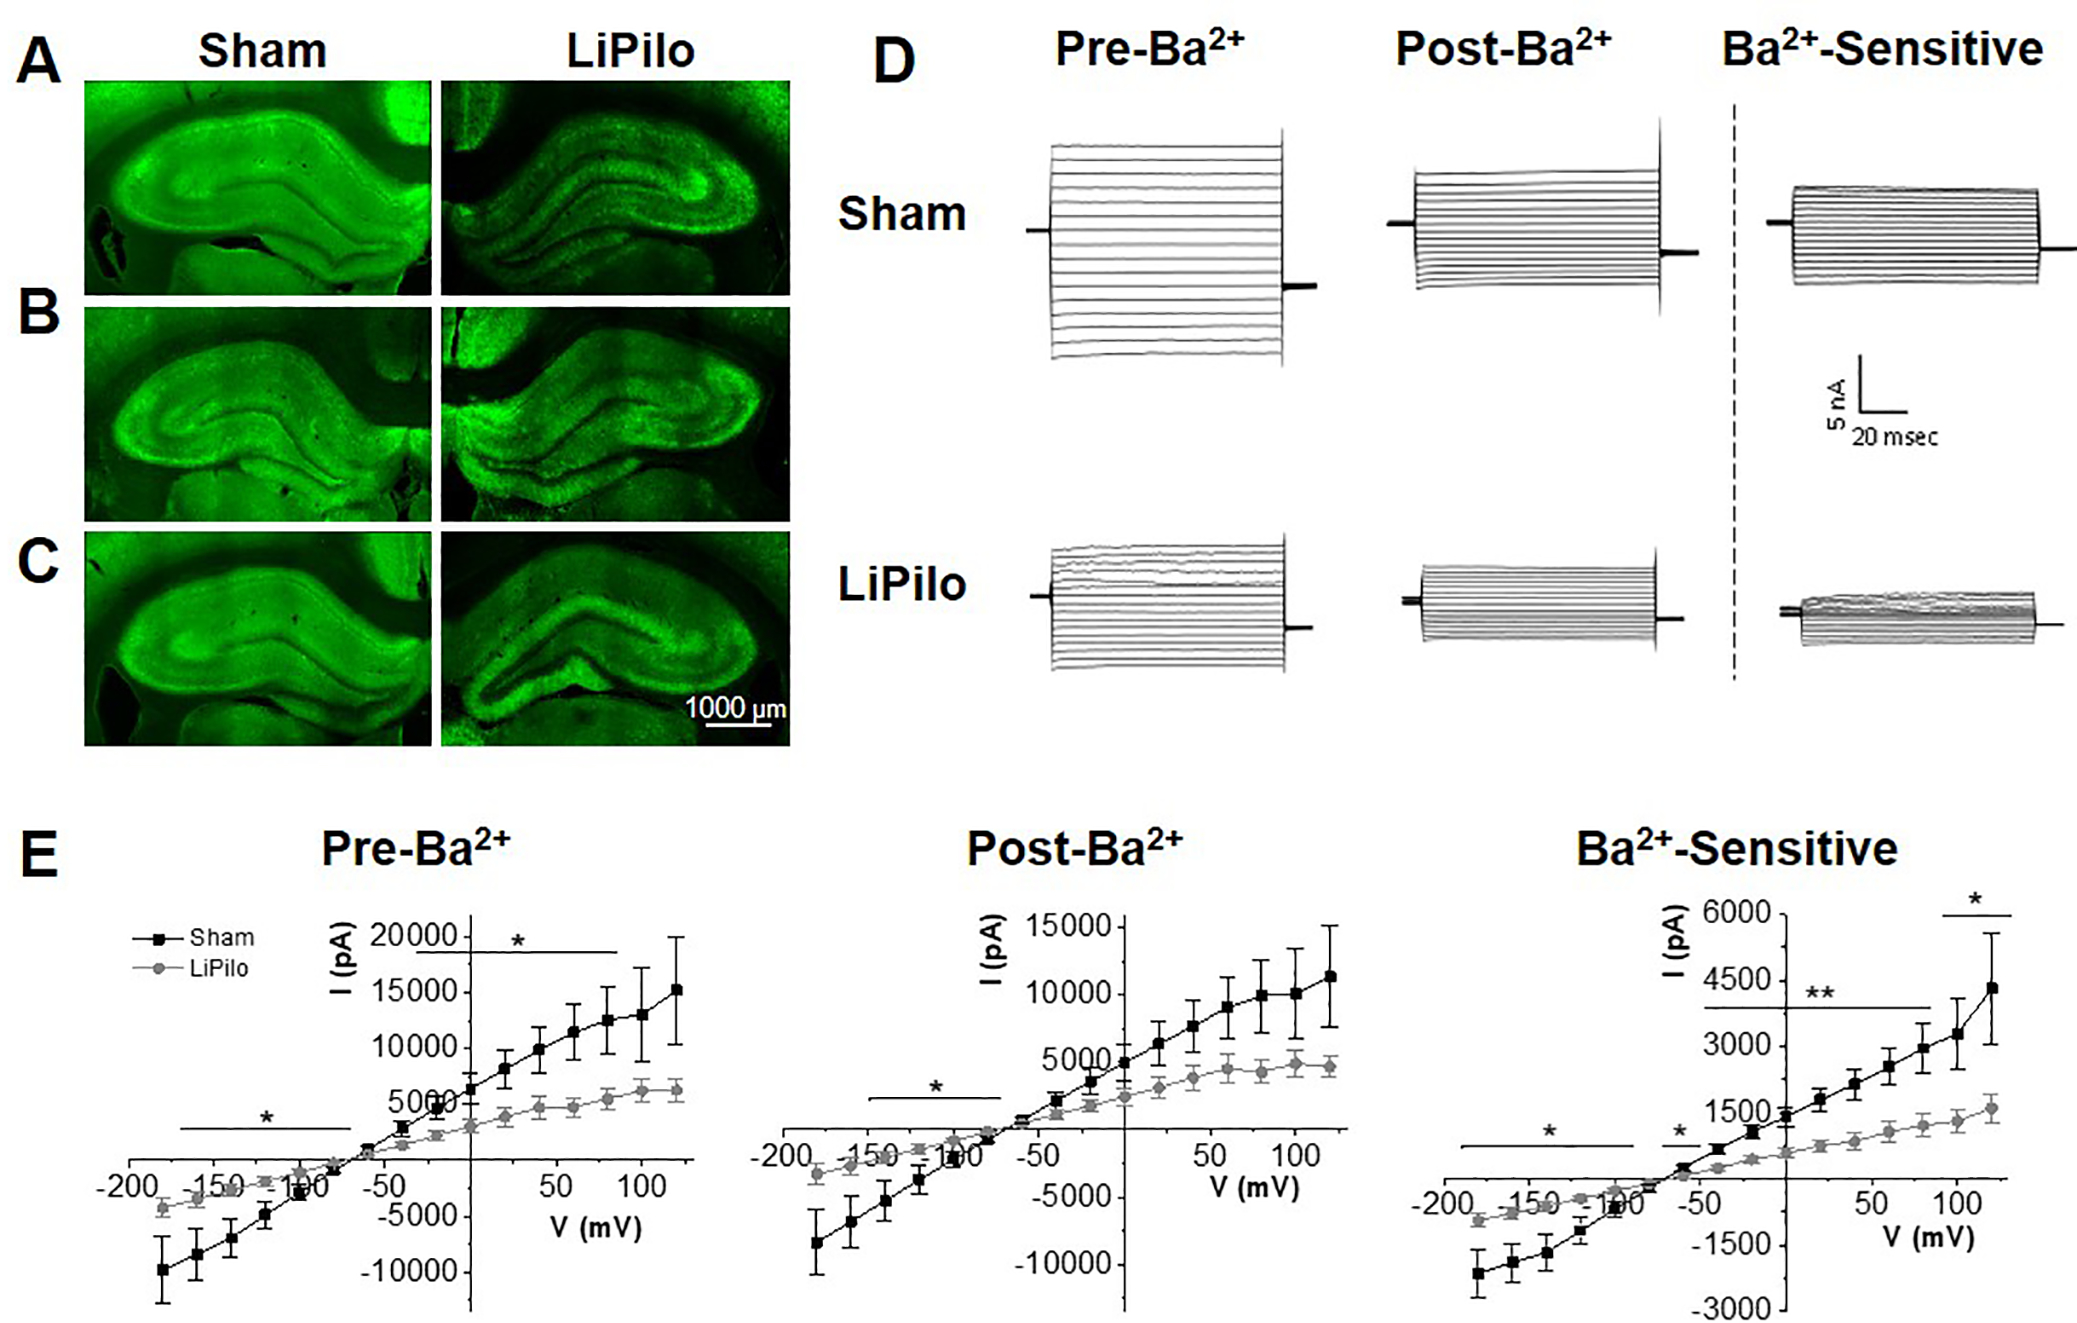
Figure 3. Kir4.1 expression is reduced in the CA1 and CA3 regions of the hippocampus post SE mirrored by reduced Kir4.1 functionality in the CA1.

Representative images of sham and pilocarpine treated animals, stained against Kir4.1 (green). Expression of Kir4.1 at 1 DPSE (A), 7 DPSE (B), 30 DPSE (C). (D) Representative current recordings in control ACSF (pre- Ba2+), ACSF to 100 mM Ba2+ (post- Ba2+ ) and Ba2+ -sensitive traces (Ba2+-sensitive) in response to a voltage step protocol (−180 mV to +80 mV, Δ20 mV) for astrocytes in the CA1 of Sham and LiPilo animals 7–14 DPSE. (E) I-V curve of control ACSF (pre- Ba2+), ACSF to 100 mM Ba2+ (post- Ba2+ ) and Ba2+-sensitive traces (Ba2+-sensitive) in response to a voltage step protocol (−180 mV to +80 mV, Δ20 mV) for each Sham and LiPilo animals. Insets – conductance as measured by the slope between −140 mV to −60 mV (Sham n=19 cells; LiPilo n=18 cells, p<0.05) Error bars represent S.E.M.
