
Figure 5. Isolated astrocytes show changes in Kir4.1 mRNA expression and changes in methylation patterns as early as 7 DPSE.
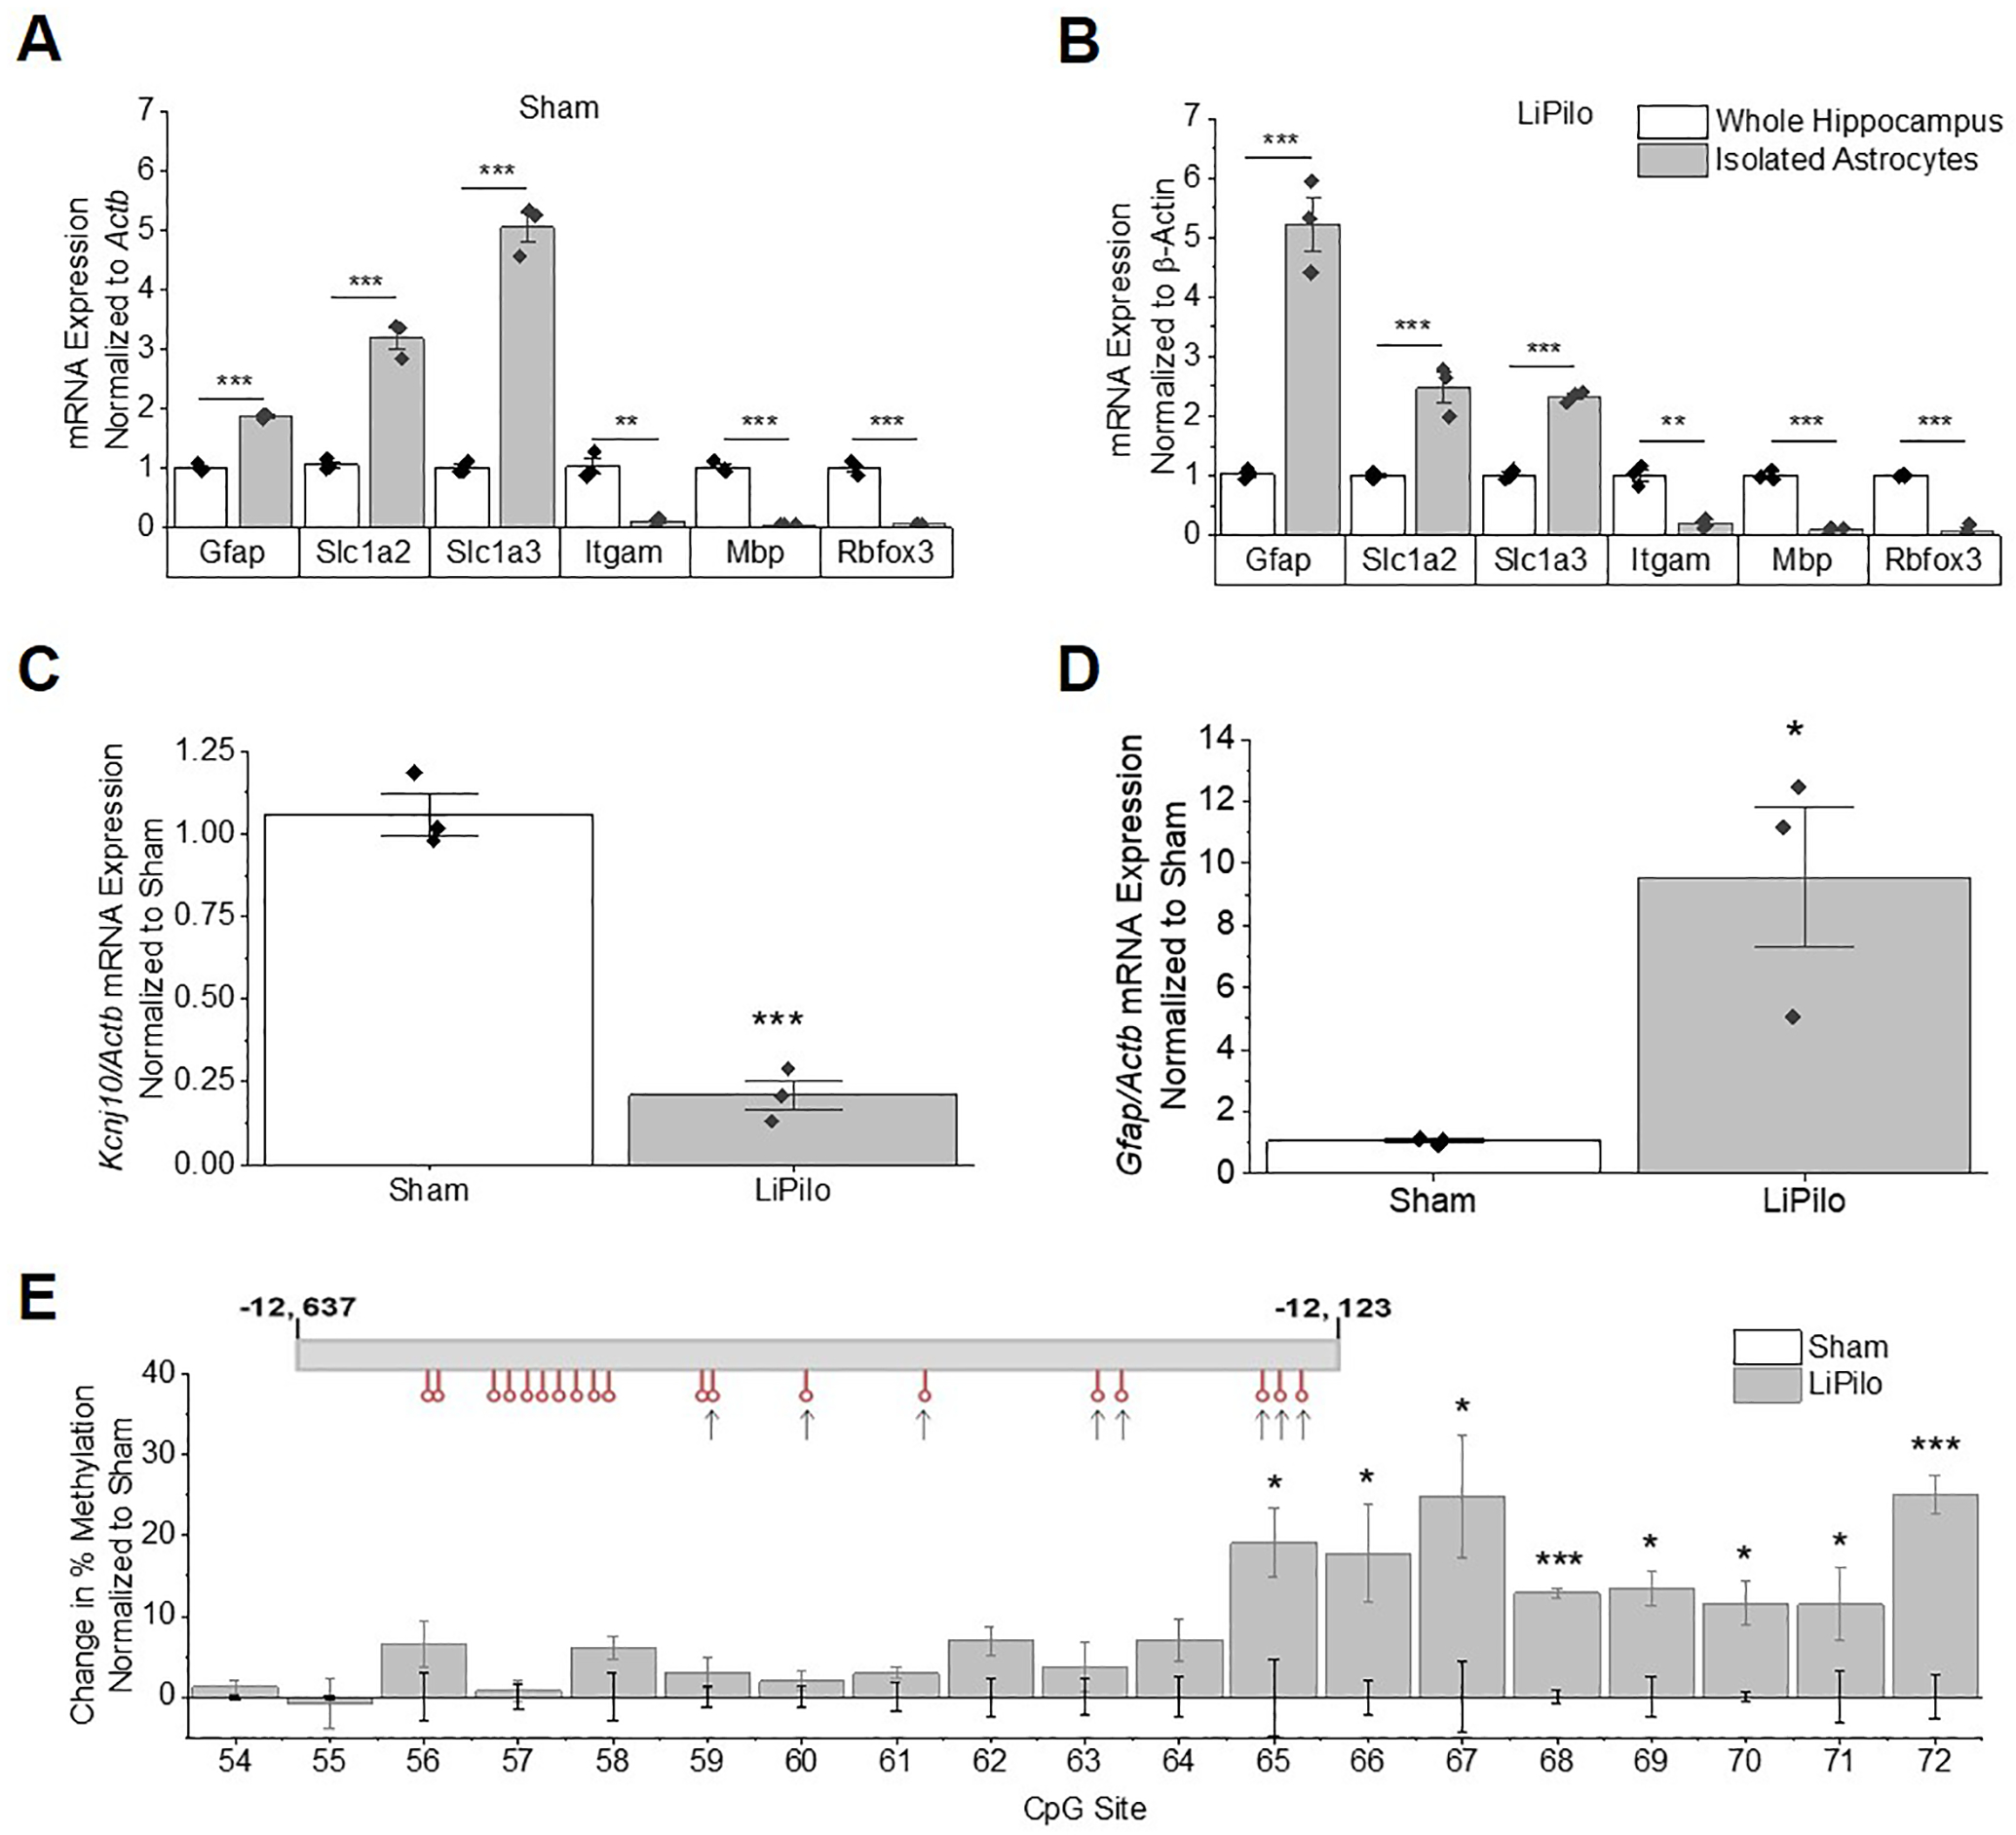
(A and B) mRNA expression of astrocytic markers (Slc1a3, Slc1a2, and Gfap) are enriched, while mRNA expression of neuronal (Rbfox3), myelin (Mbp), and microglial (Itgam) markers are depleted relative to whole hippocampal isolates of Sham (A: Gfap T4=18.77, p<0.0001, n=3,3; Slc1a2 T4=11.67, p<0.001, n=3,3; Slc1a3 T4=16.30, p<0.0001, n=3,3; Itgam T4=7.014, p=0.0022, n=3,3; Mbp WelchT2.013=17.32, p=0.0032, n=3,3; Rbfox WelchT2.011=13.50, p=0.0053, n=3,3) and LiPilo (B: Gfap T4=9.391, p<0.001, n=3,3; Slc1a2 T4=5.949, p=0.0040, n=3,3; Slc1a3 T4=20.21, p<0.0001, n=3,3; Itgam T4=7.492, p=0.0017, n=3,3; Mbp T4=15.28, p<0.001, n=3,3; Rbfox T4=15.47, p<0.001, n=3,3). (C) qPCR analysis shows Kcnj10 transcripts are reduced in isolated astrocytes at 7 DPSE (T4=10.86, p<0.001, n=3,3). (D) qPCR analysis shows Gfap transcripts are increased in isolated astrocytes at 7 DPSE (WelchT2.004=4.530, p=0.0453, n=3,3). (E) Percent change in methylation normalized to sham animals is graphed (CpG Site 65 T4=3.010, p=0.0395, n=3,3; CpG Site 66 T4=2.924, p=0.0431, n=3,3;CpG Site 67 T4=2.809, p=0.0483, n=3,3; CpG Site 68 T4=12.10, p<0.001, n=3,3; CpG Site 69 T4=4.049, p=0.0155, n=3,3; CpG Site 70 T4=4.209, p=0.0136, n=3,3; CpG Site 71 T4=2.936, p=0.0425, n=3,3; CpG Site 72 T4=7.084, p=0.0021, n=3,3). Error bars represent S.E.M.