Figure 5.

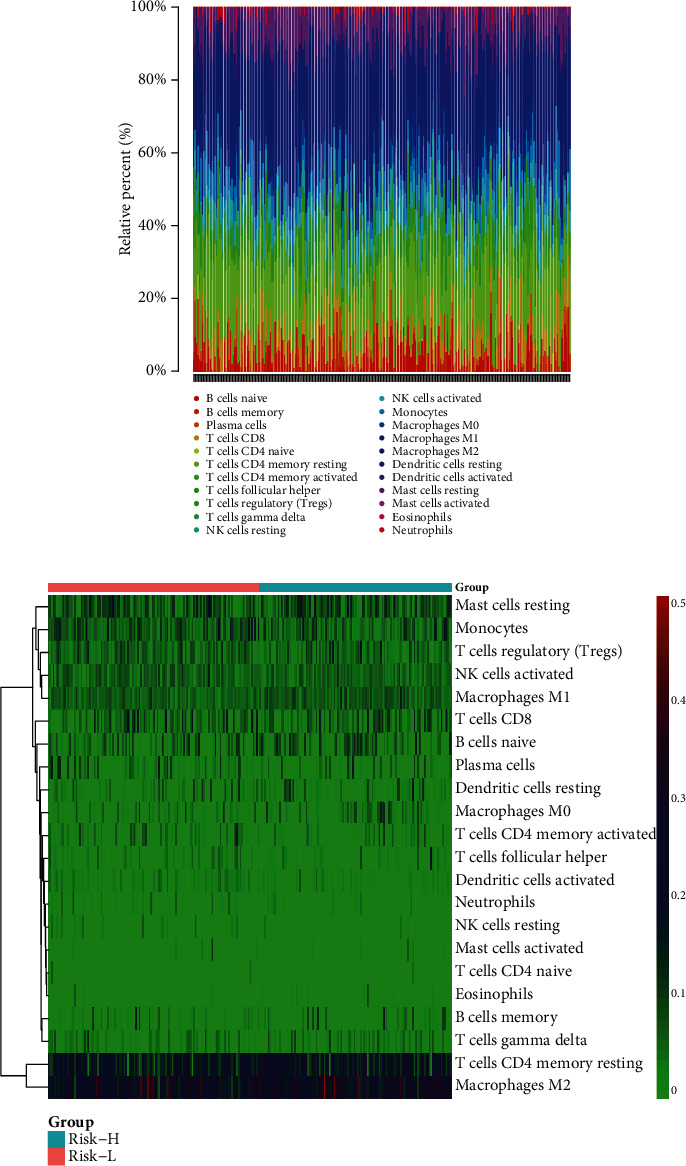
Immune infiltration landscape in Risk-H and Risk-L cohorts. (a) Relative percentages of 22 immune cell types in respective sarcoma samples. (b) Heat map of 22 immune cell types in The Cancer Genome Atlas sarcoma cohort.

Immune infiltration landscape in Risk-H and Risk-L cohorts. (a) Relative percentages of 22 immune cell types in respective sarcoma samples. (b) Heat map of 22 immune cell types in The Cancer Genome Atlas sarcoma cohort.