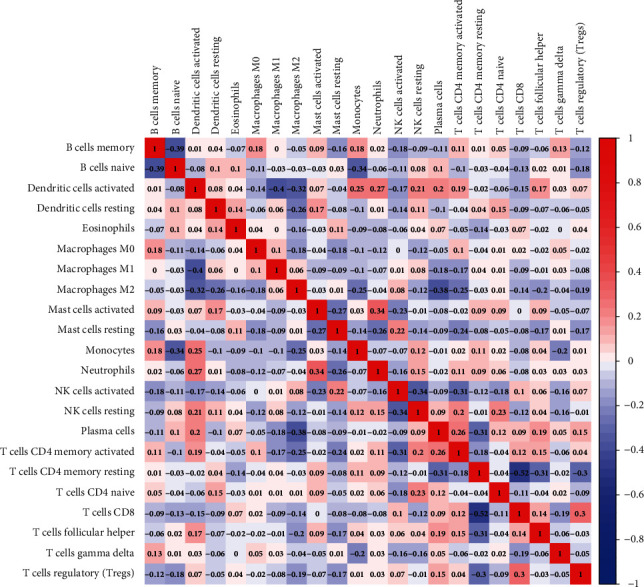
Figure 7.

A correlation matrix consisting of all 22 immune cell types. Immune cell types may be seen on both the horizontal and vertical axes. Composition of immune cell types (closer to white means lower correlation, deep blue means strong negative correlation, and deep red means strong positive correlation).
