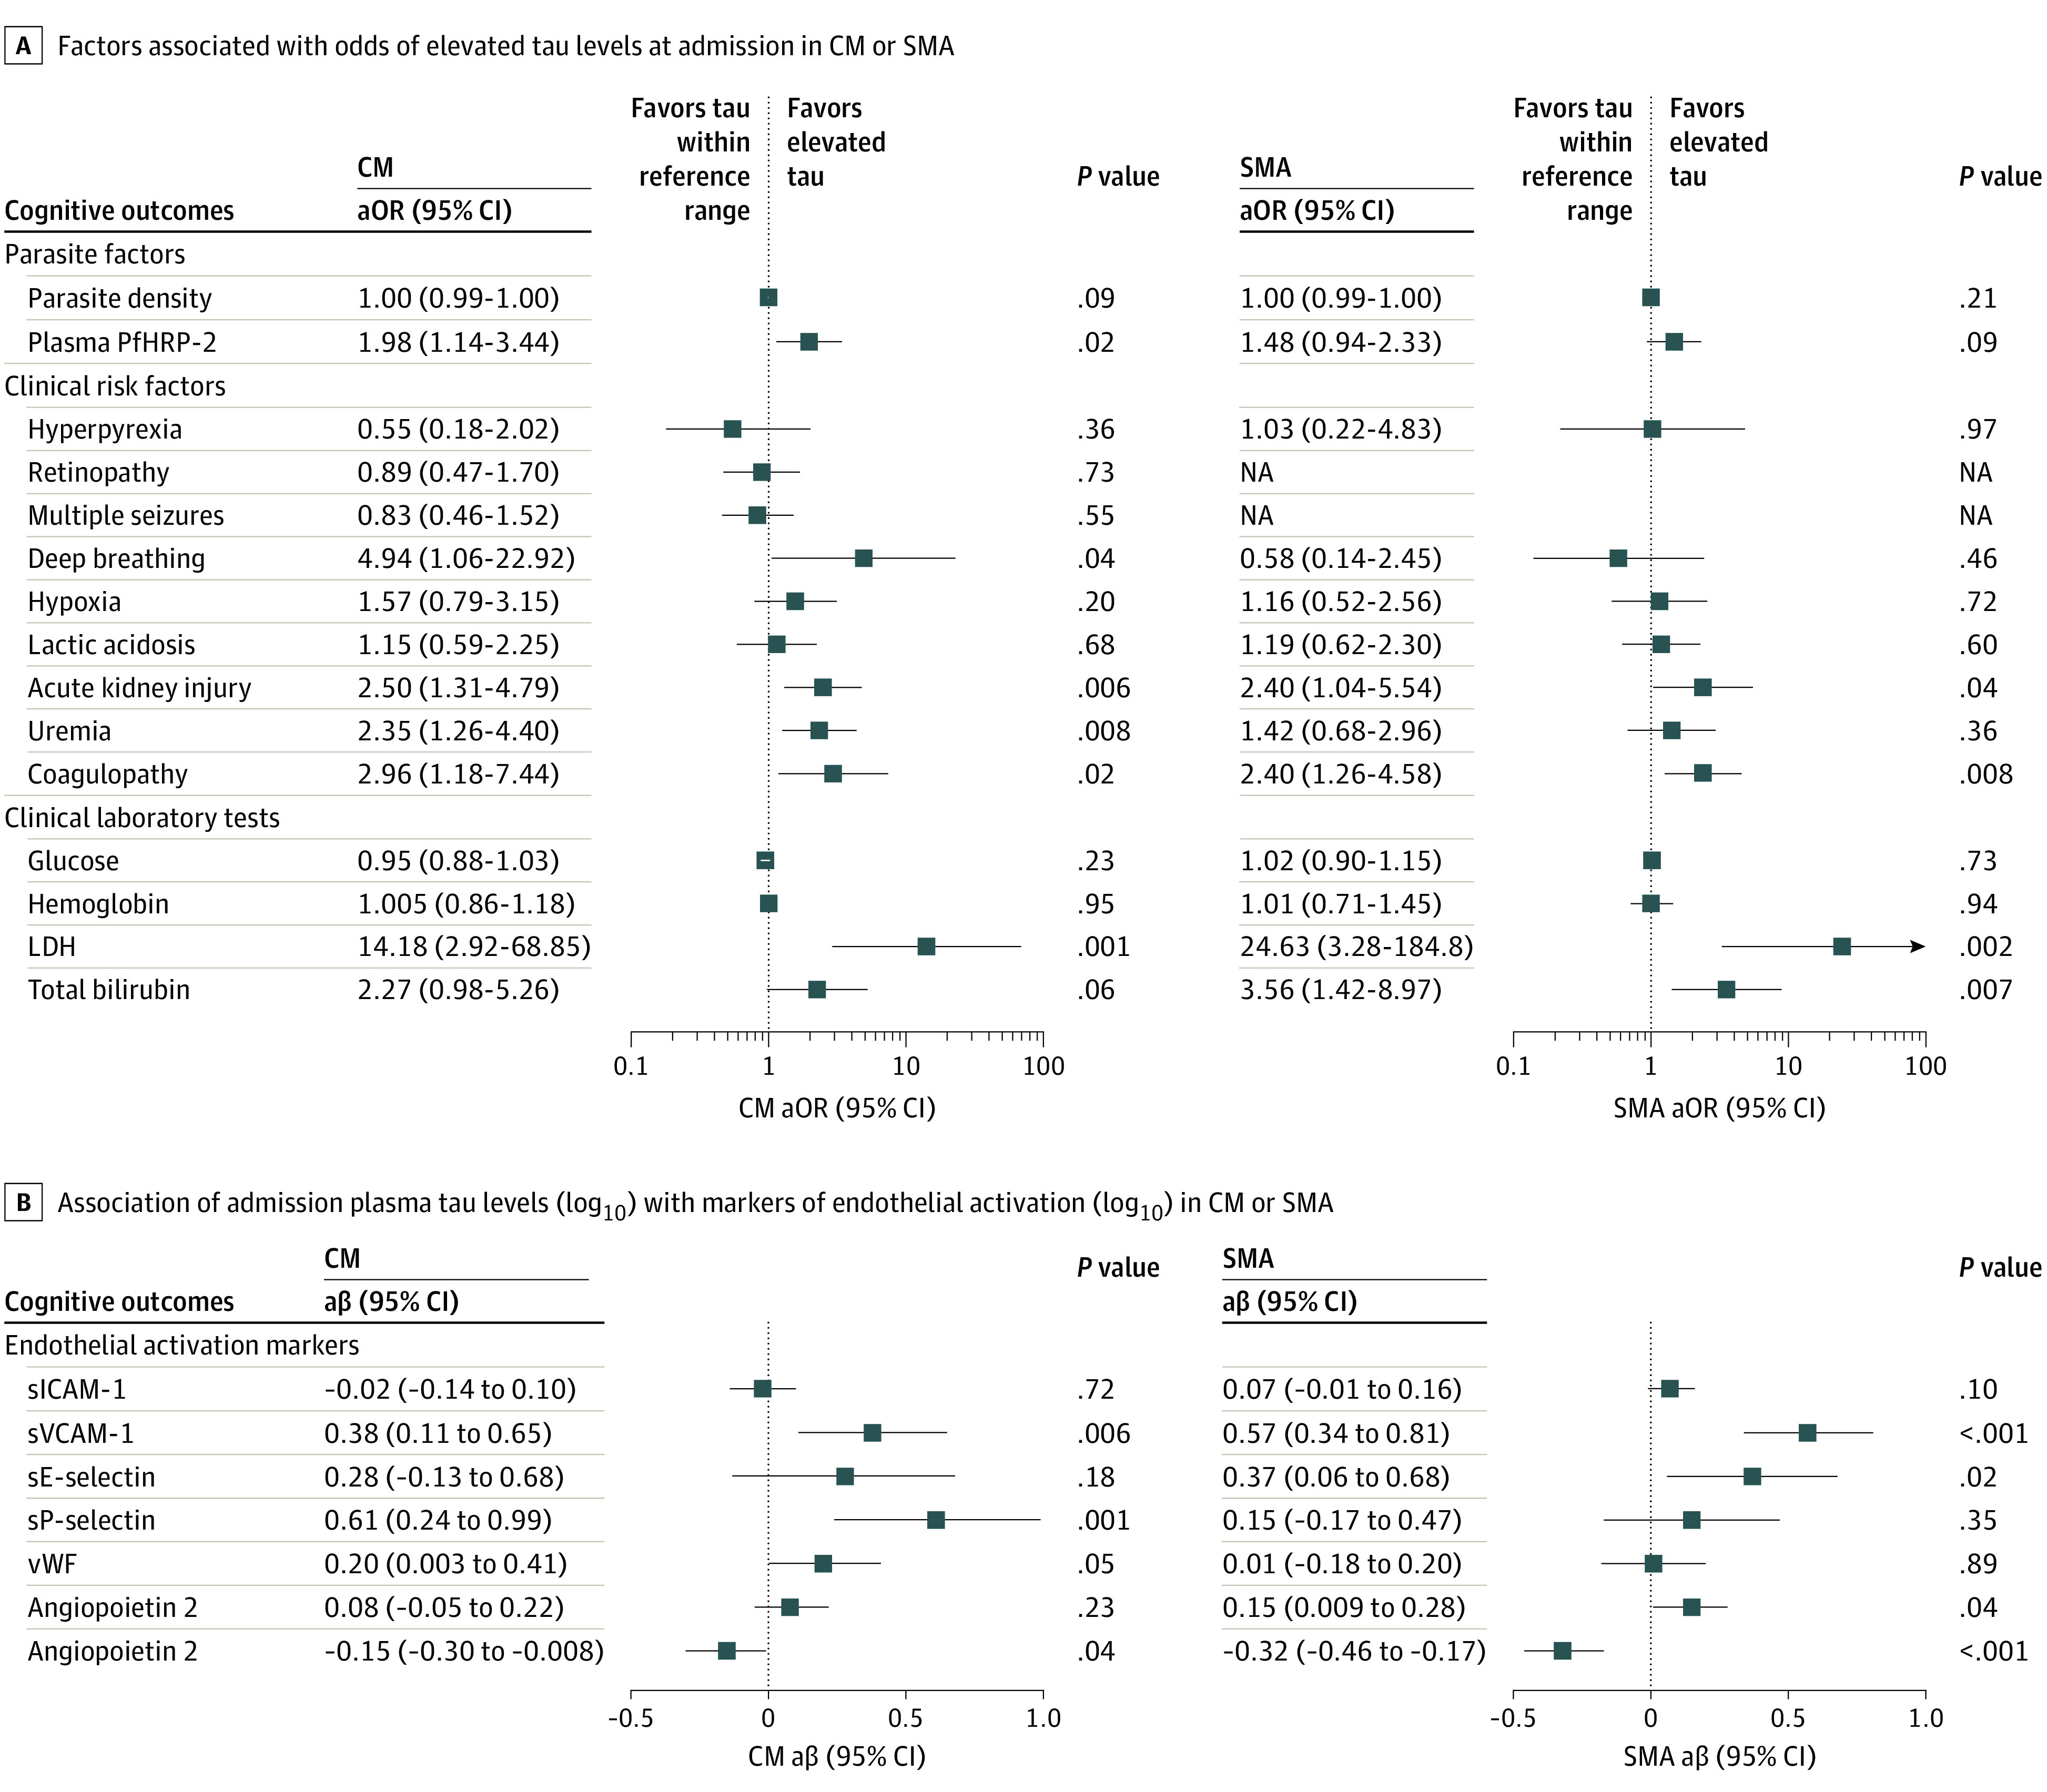
Figure 4. Admission Plasma Tau Associations With Clinical Risk Factors and Endothelial Activation Markers.

A, Median adjusted odds ratios (aORs) and 95% CIs are shown. P values indicate univariable logistic regression analysis. eTable 2 in the Supplement shows differences between factors based on tau levels in the reference range vs elevated. B, Median adjusted β (aβ) coefficient and 95% CI are shown. P values indicate univariable linear regression analysis. CM indicates cerebral malaria; LDH, lactate dehydrogenase; PfHRP-2, Plasmodium falciparum histidine-rich protein-2; sE-selectin, soluble E-selectin; sICAM-1, soluble intercellular adhesion molecule-1; SMA, severe malarial anemia; sP-selectin, soluble P-selectin; sVCAM-1, soluble vascular cell adhesion molecule-1; vWF, von Willebrand factor.
