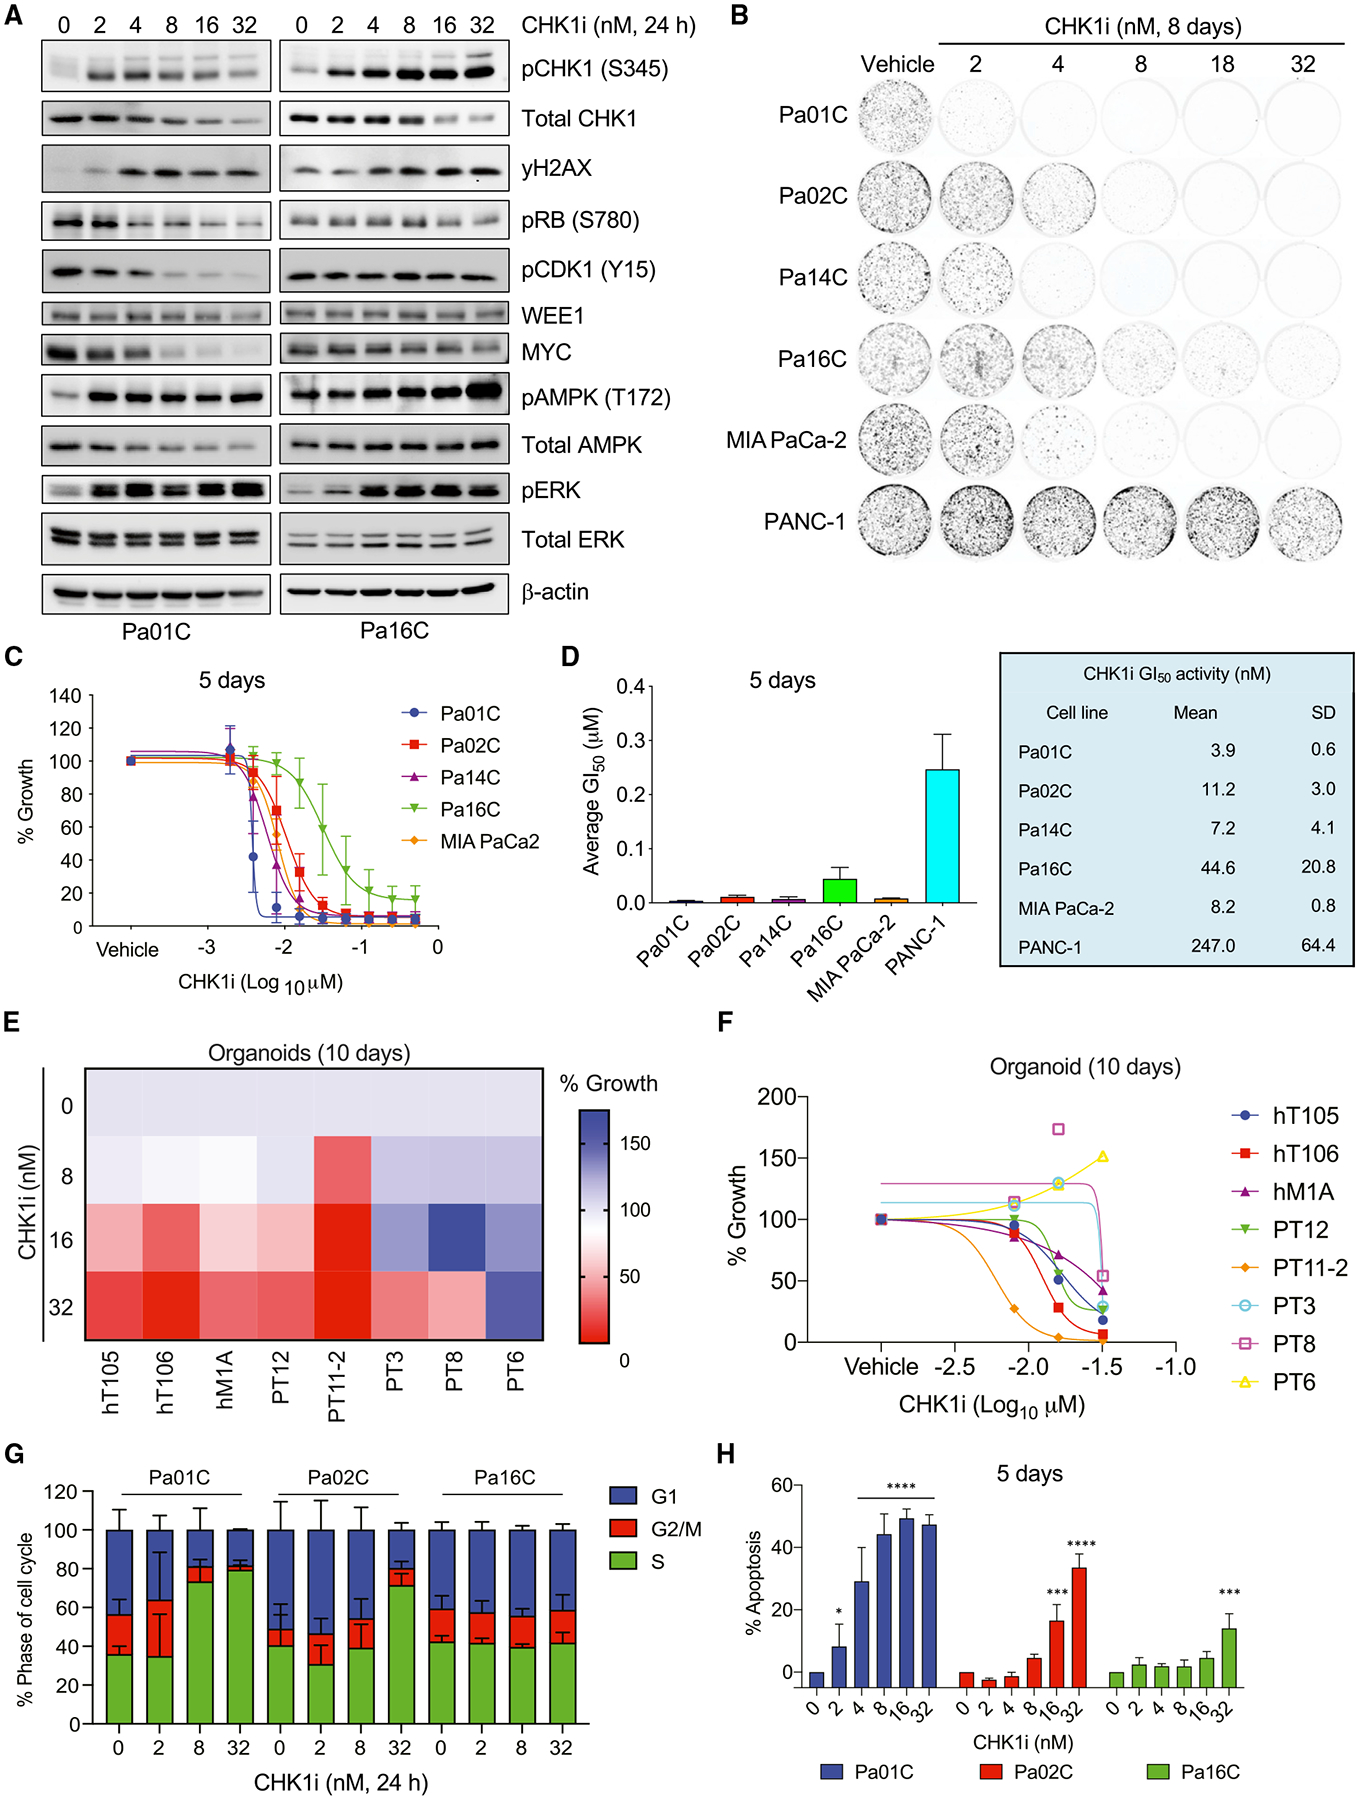
Figure 2. CHK1i blocks PDAC growth and induces S-phase arrest and apoptosis.

(A) Immunoblot analyses of PDAC cell lines treated with increasing concentrations of CHK1i for 24 h.
(B) Clonogenic proliferation assay to monitor growth suppression of PDAC cell lines treated (8 days) with the indicated concentrations (nM) of CHK1i.
(C) Anchorage-dependent growth of PDAC cell lines was evaluated by live cell counting following CHK1i treatment for 5 days.
(D) The mean GI50 with SD of data shown in (C).
(E and F) PDAC organoid growth was monitored by the CellTiter-Glo viability assay after treatment (10 days) with the indicated concentrations of CHK1i. (E) The median of three biological replicates for each treatment is shown, and a shift from blue to red indicates a reduction in growth. (F) Individual growth values are shown for each organoid line at each concentration of CHK1i.
(G) The percentages of cells in the indicated phases of the cell cycle were determined using propidium iodide staining and flow cytometry following 24 h of treatment with the indicated CHK1i concentration (nM).
(H) The percentage of cells undergoing apoptosis was evaluated in three PDAC lines with varying degrees of growth sensitivity to CHK1i (5 days). Apoptosis was monitored using fluorescence-activated cell sorting (FACS) analysis of Annexin V- and propidium iodide-labeled cells. Statistical significance was evaluated using one-way ANOVA and Dunnett’s multiple-comparisons test; **p < 0.01, ***p < 0.001, ****p < 0.0001.
In (A)–(D), (G), and (H), all experiments were performed in biological triplicate, immunoblots are representative images, and graphs show mean and SD.
