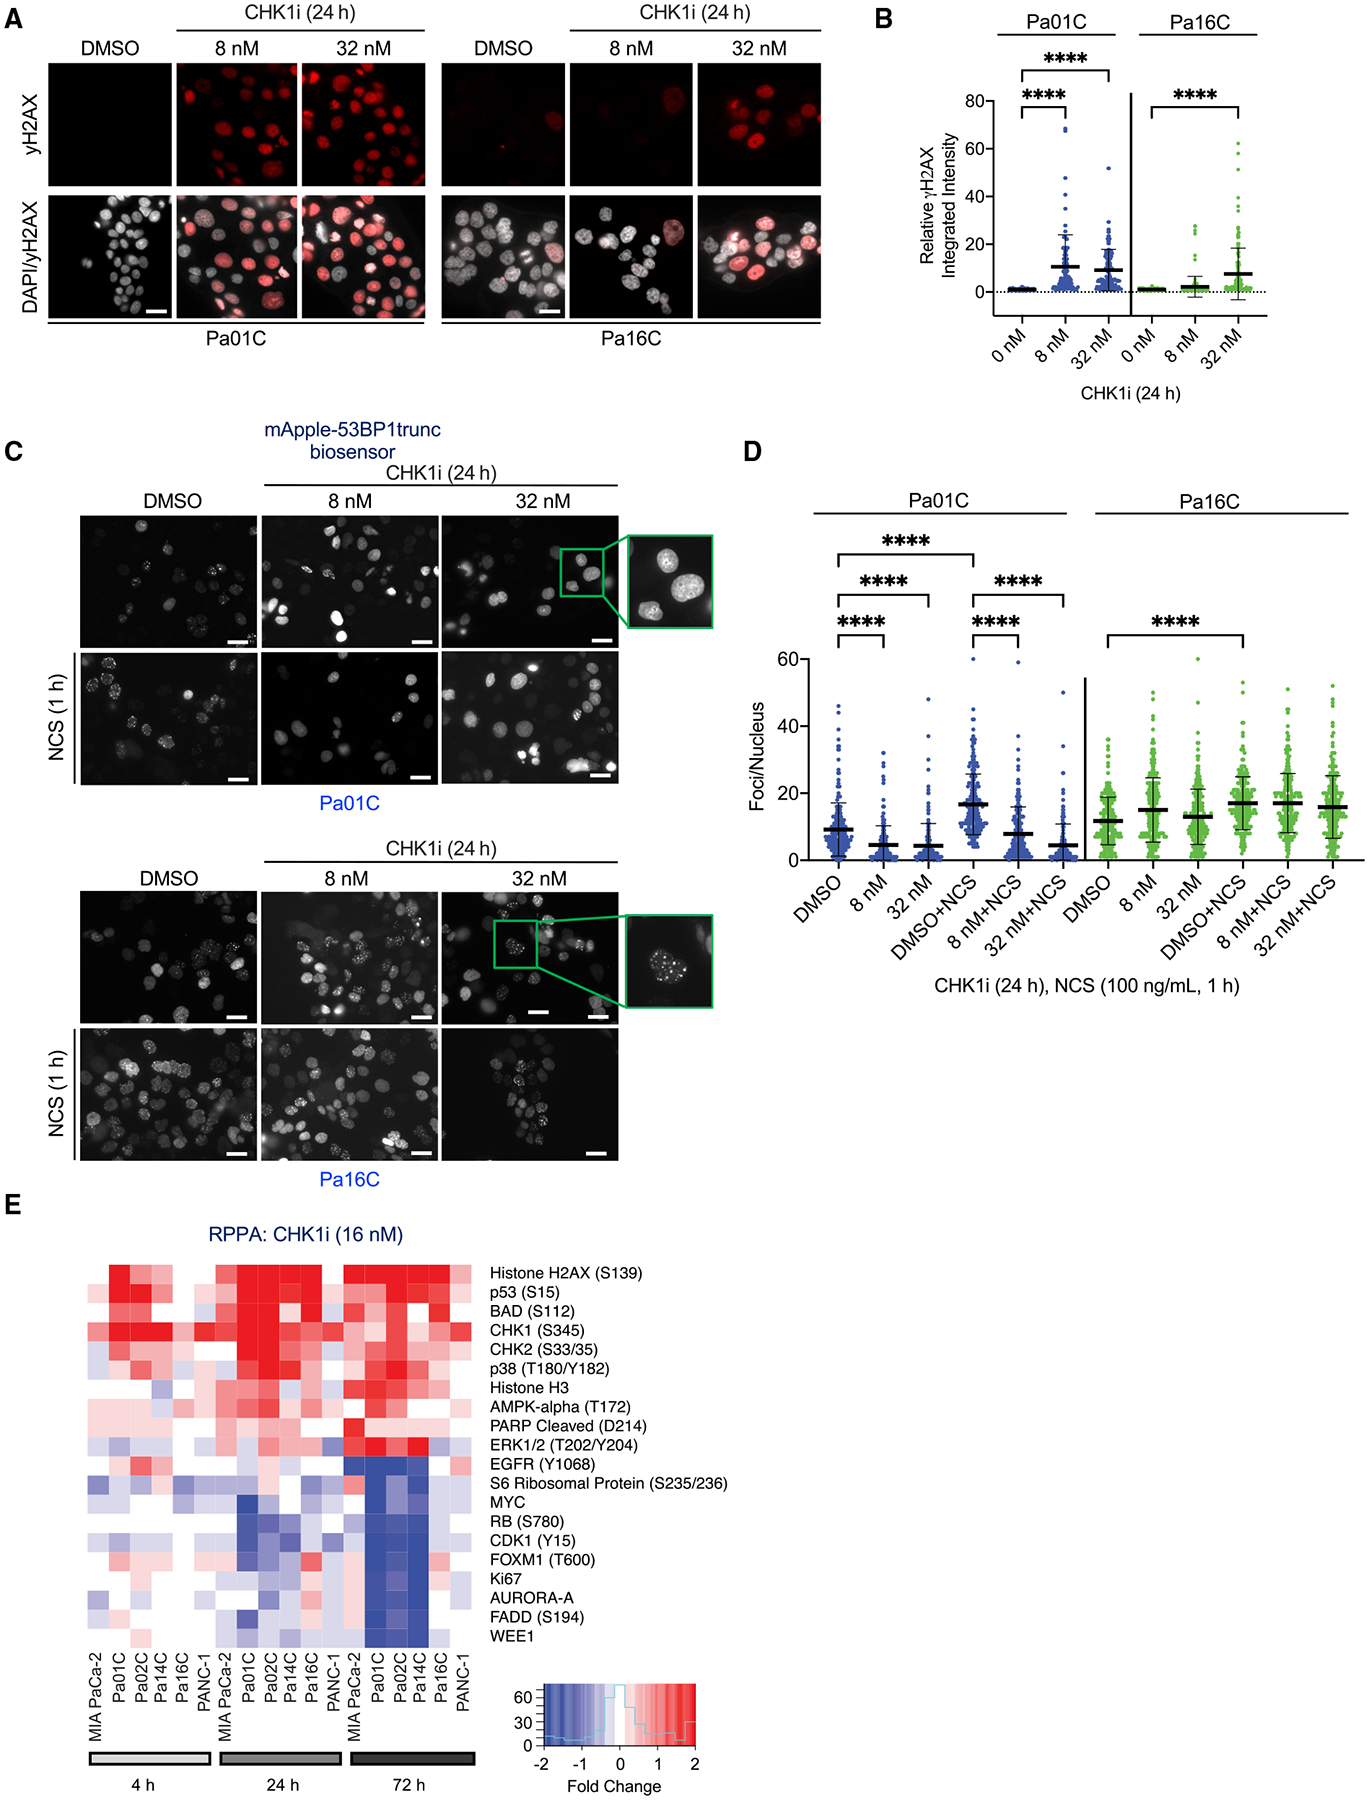
Figure 3. CHK1i promotes DNA damage and loss of 53BP1-mediated repair.

(A) Representative images of immunofluorescence to monitor γH2AX expression (red) and nuclei (white) in PDAC cells following CHK1i treatment (24 h) at the indicated concentrations (nM). Scale bar, 25 μm.
(B) The relative integrated intensity of γH2AX per nucleus of the indicated cell lines treated with different doses of CHK1i. Each dot represents a nucleus, error bars represent the SD. Statistical significance was evaluated using one-way ANOVA with Dunnett’s multiple-comparisons test; ****p < 0.0001.
(C) Representative images of Apple-tagged trunc53BP1 in PDAC cells following DMSO or CHK1i treatment for 24 h and/or the irradiation mimic neocarzinostatin (NCS) for 1 h at 100 ng/mL. Boxes show zoomed-in views with (Pa16C) or without (Pa01C) foci following CHK1i treatment. Scale bar, 25 μm.
(D) The number of mApple-tagged trunc53BP1 foci per nucleus was evaluated. Statistical significance was evaluated using one-way ANOVA with Dunnett’s multiple-comparisons test; ****p < 0.0001. Each dot represents a nucleus and error bars the SD.
(E) Heatmap of RPPA analyses to evaluate changes in the levels of phosphorylated (site[s] in parentheses) or total expression of the indicated proteins following CHK1i (15 nM) treatment for the indicated times in six PDAC cell lines. Shown are the median values from four biological replicates and highlights of the ten most up- and downregulated proteins.
