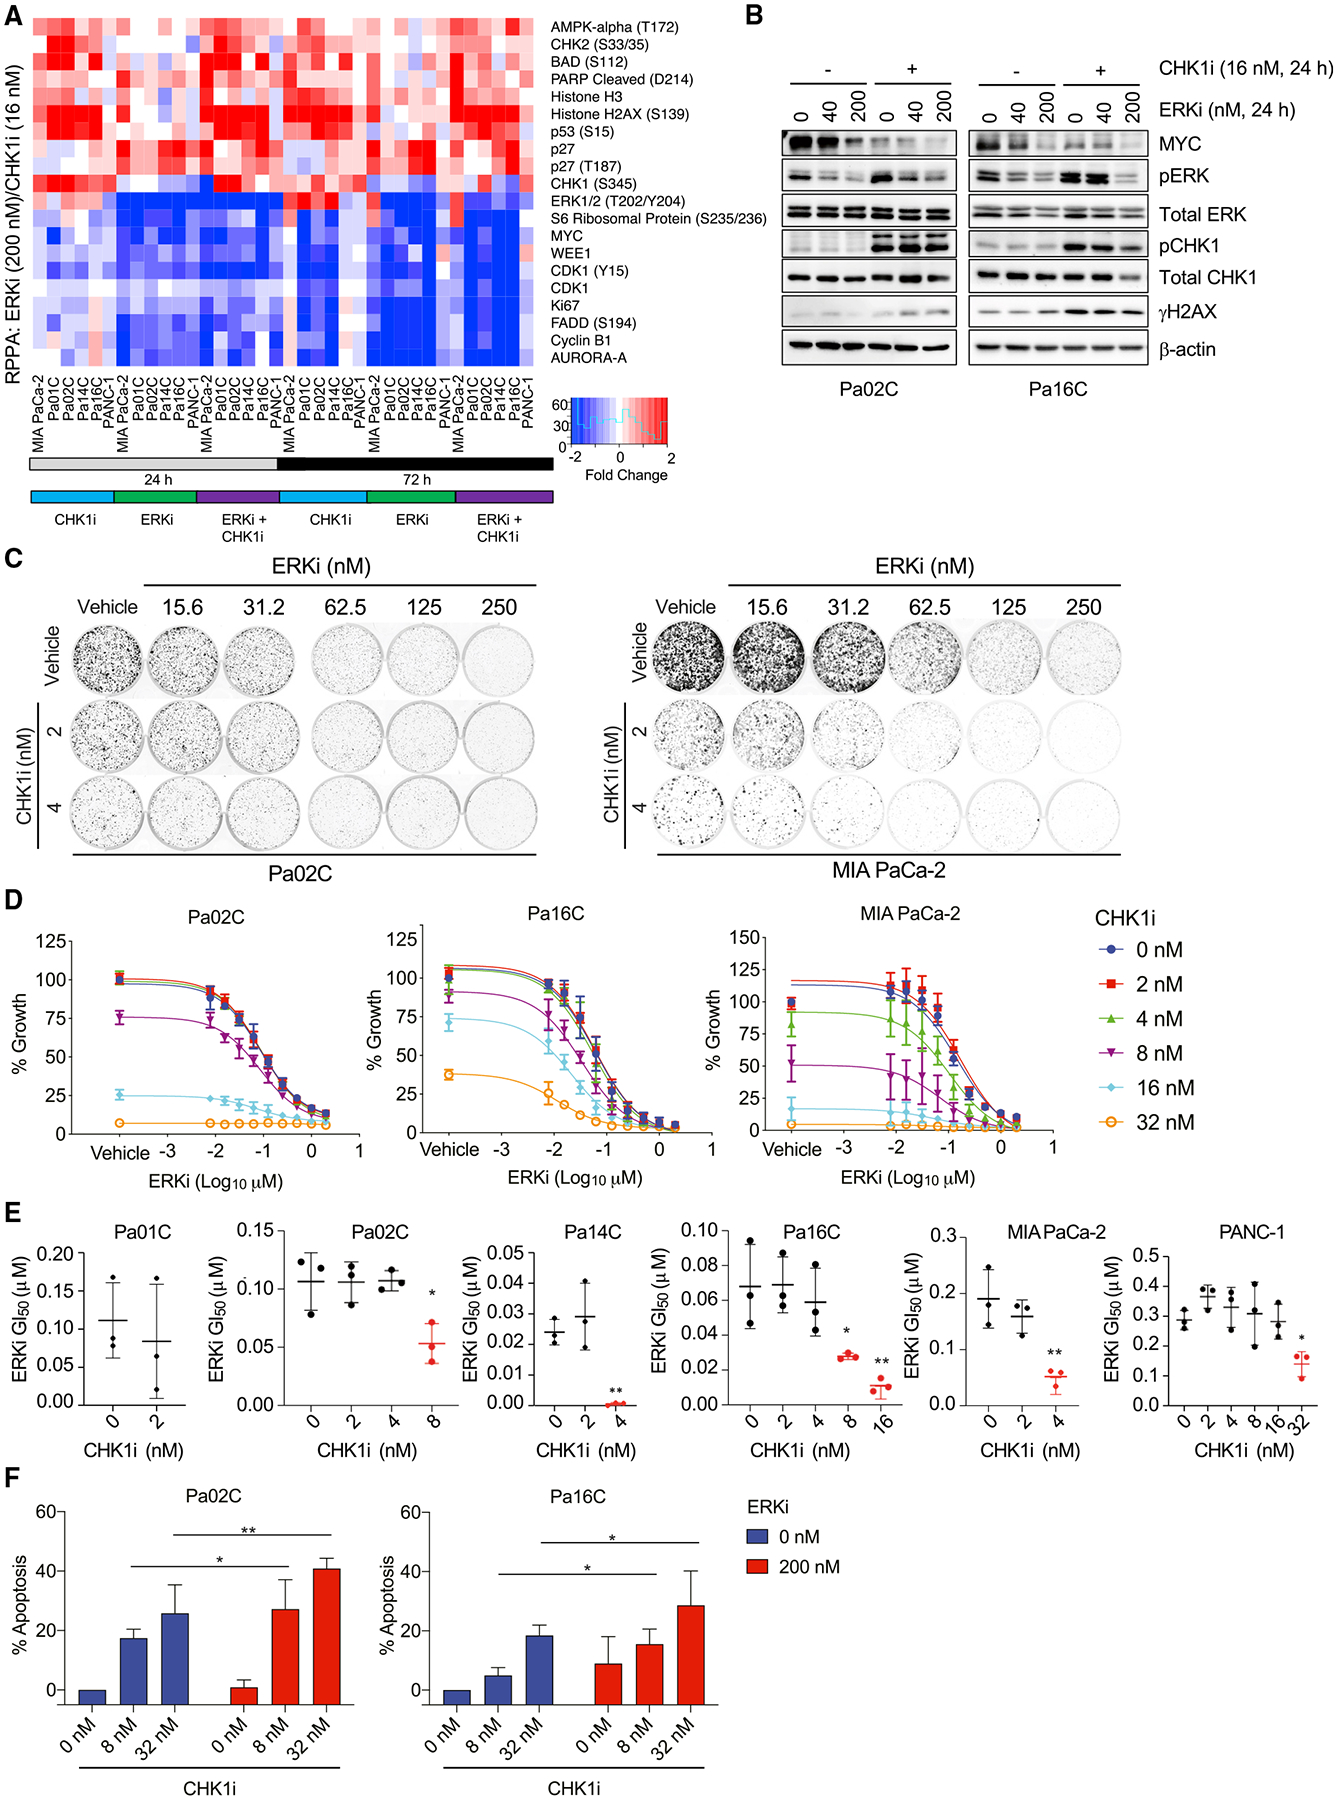
Figure 4. Concurrent CHK1i treatment enhances ERKi-mediated growth suppression and apoptosis.

(A) RPPA analyses of PDAC cell lines following 24 or 72 h treatment with CHK1i (15 nM) and/or ERKi (200 nM). The heatmap depicts the median values from four biological replicates and the ten most up- and downregulated protein changes on the basis of mean values of all cell lines evaluated.
(B) Immunoblot analyses to monitor the indicated phosphorylated/total protein levels in cells treated (24 h) with the indicated concentrations of CHK1 and/or ERKi.
(C) Clonogenic growth assay of PDAC cell lines treated for 8 days with the indicated inhibitor concentrations. Cells were visualized using staining with crystal violet.
(D) Growth of PDAC cell lines was evaluated using live cell counting following CHK1i and/or ERKi treatment for 5 days.
(E) The mean ERKi GI50 was determined following treatment with different concentrations of CHK1i. One-way ANOVA with Dunnett’s multiple-comparisons test was used to determine significance; *p < 0.05, **p < 0.01.
(F) Percentage of cells undergoing apoptosis induced by treatment with CHK1i and/or ERKi was determined using FACS analysis of Annexin V- and propidium iodide-labeled cells. Significance was determined using two-way ANOVA and Tukey’s multiple-comparisons test; *p < 0.05, **p < 0.01.
In (B)–(F), all experiments were performed in biological triplicate, for immunoblots a representative image is shown, and graphs depict mean and SD.
