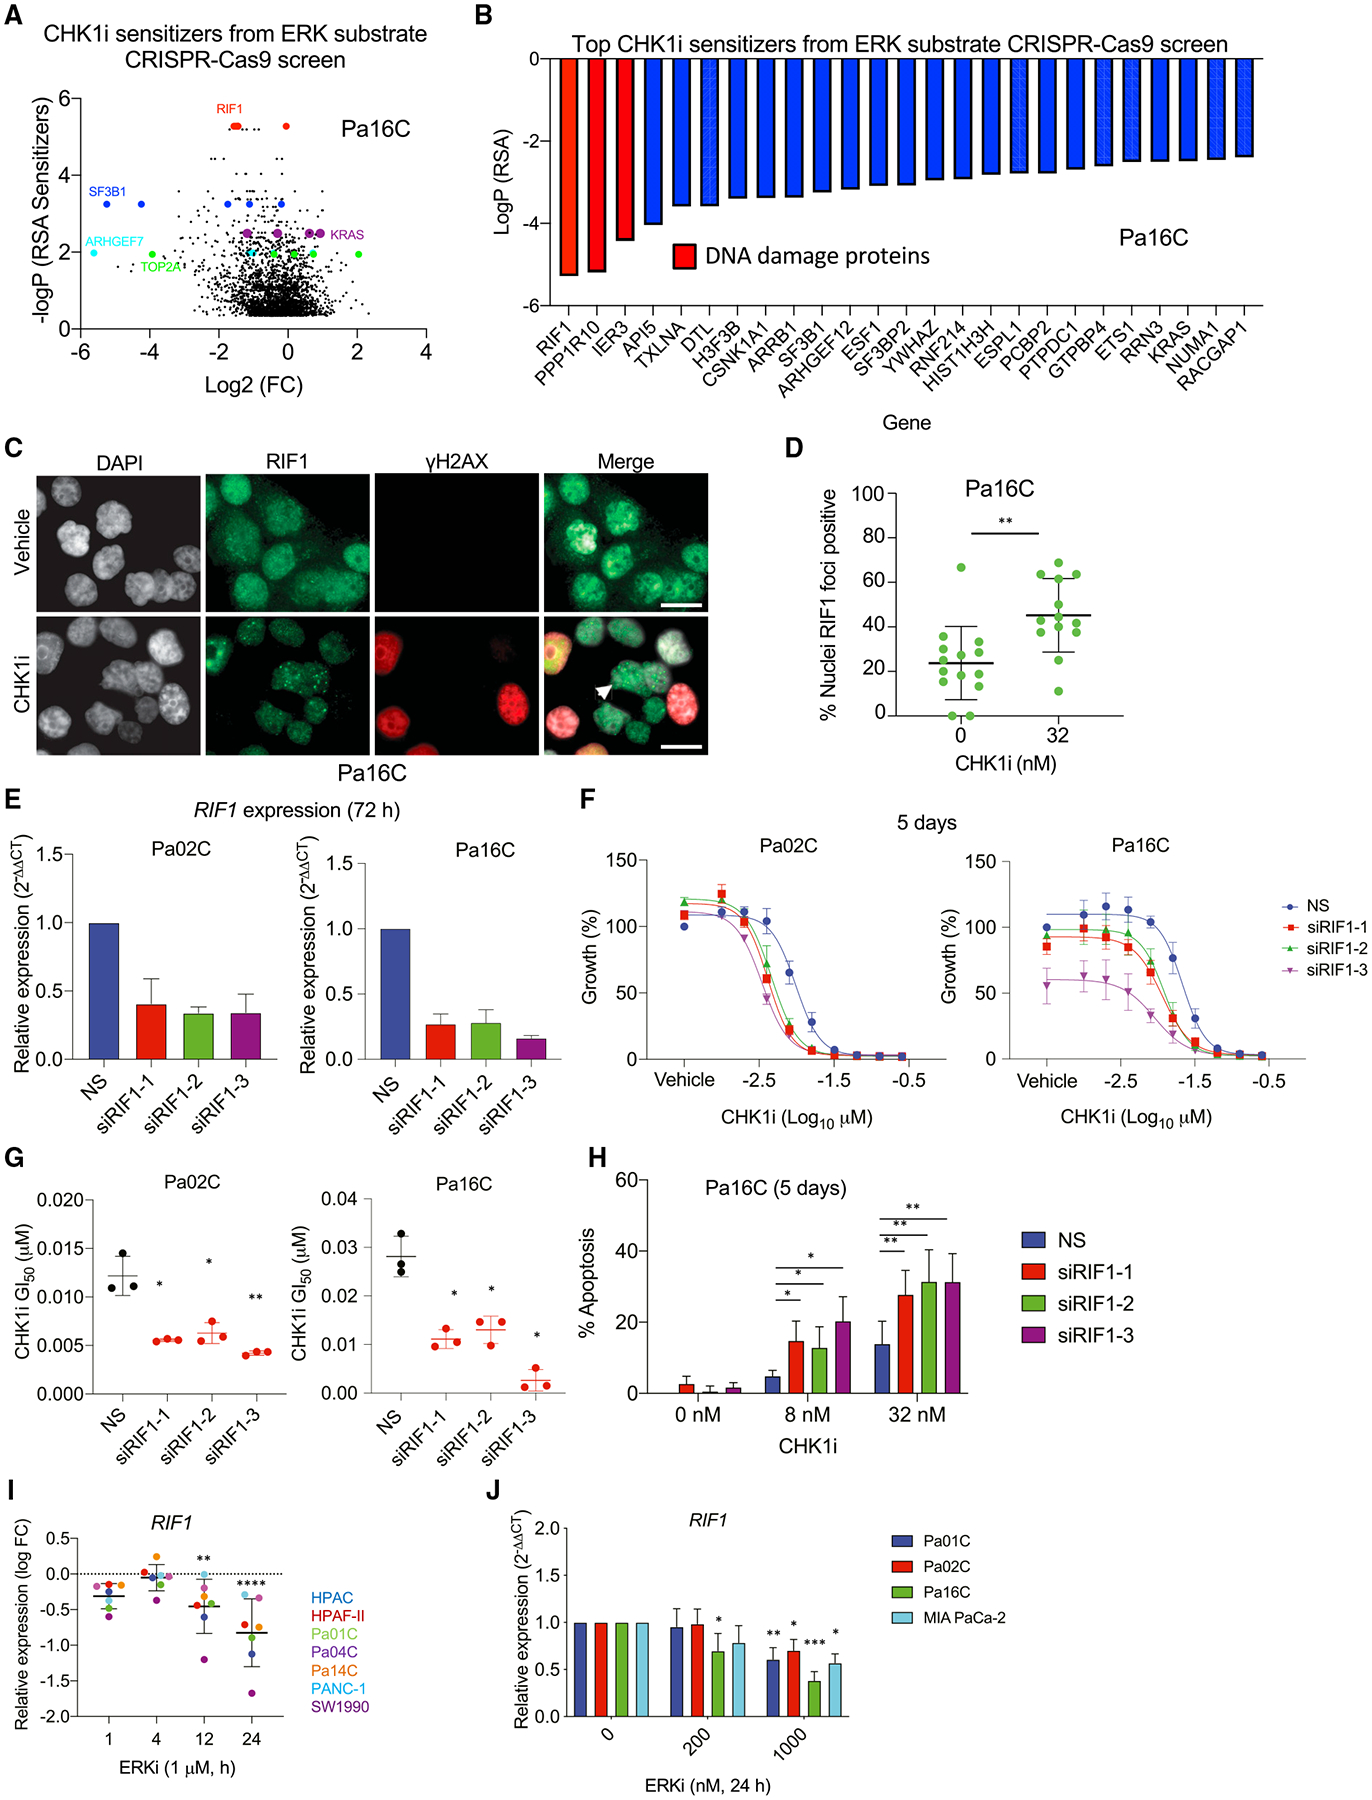
Figure 6. Loss of RIF1 increases sensitivity to CHK1i.

(A) Shown is a volcano plot comparing the log2 fold change (FC) versus the −logP (RSA sensitizer) of data from the CRISPR-Cas9 ERK substrate library screen to identify genes that modulate sensitivity to treatment with CHK1i at GI25 (15 nM, 4 weeks) or with DMSO vehicle control.
(B) Top 25 genes identified in the screen in (A) were ranked by logP following RSA analysis, relative to vehicle-treated cells.
(C) Representative immunofluorescence images of RIF1 (green) and γH2AX (red) expression following CHK1i or vehicle treatment. DAPI staining was done to visualize nuclei (white). Arrowhead indicates a RIF1 foci-positive nucleus; scale bar, 25 μm.
(D) Quantification of the percentage of RIF-positive nuclei. Significance was evaluated using an unpaired t test; **p < 0.01.
(E) Relative RIF1 expression was determined using qRT-PCR to quantify knockdown after treatment (72 h) with three distinct siRNAs targeting RIF1 or NS control in Pa02C and Pa16C PDAC cell lines further characterized in (F)–(H).
(F) Growth was evaluated using live cell counting following RIF1 knockdown and CHK1i treatment (5 days). Cells were reverse-transfected with NS or three different siRNAs targeting RIF1 and treated with CHK1i starting 12 h later.
(G) Graph showing the GI50 for CHK1i in NS versus RIF1 knockdown cells as in (F). Significance was determined by one-way ANOVA with Dunnett’s multiple-comparisons test; *p < 0.05, **p < 0.01.
(H) RIF1 was depleted in Pa16C cells via siRNA for 12 h, and then cells were treated with CHK1i for an additional 5 days. Apoptosis was monitored using FACS analysis of propidium iodide and fluorescein isothiocyanate (FITC)-Annexin-stained cells. Significance was determined using two-way ANOVA and Tukey’ s multiple-comparisons test; *p < 0.05, **p < 0.01.
(I) Cells were treated with 1 μM ERKi for the indicated times. RNA was collected and analyzed using RNA-seq. Statistical significance was determined using dispersion corrected, moderated t tests as implemented in limma; **p < 0.01, ***p < 0.001. Each dot represents a cell line.
(J) Cells were treated with the indicated concentrations of ERKi for 24 h, then RNA was collected and evaluated using qRT-PCR. Significance was determined using one-way ANOVA and Dunnett’s multiple-comparisons test, where each treatment was compared with DMSO treatment; *p < 0.05, **p < 0.01, ***p < 0.001.
In (C)–(H) and (J), all experiments were performed in biological triplicate. and graphs depict mean and SD.
